Immigrants from Liberia vs Bahamian Male Disability
COMPARE
Immigrants from Liberia
Bahamian
Male Disability
Male Disability Comparison
Immigrants from Liberia
Bahamians
11.9%
MALE DISABILITY
1.0/ 100
METRIC RATING
245th/ 347
METRIC RANK
11.9%
MALE DISABILITY
1.1/ 100
METRIC RATING
241st/ 347
METRIC RANK
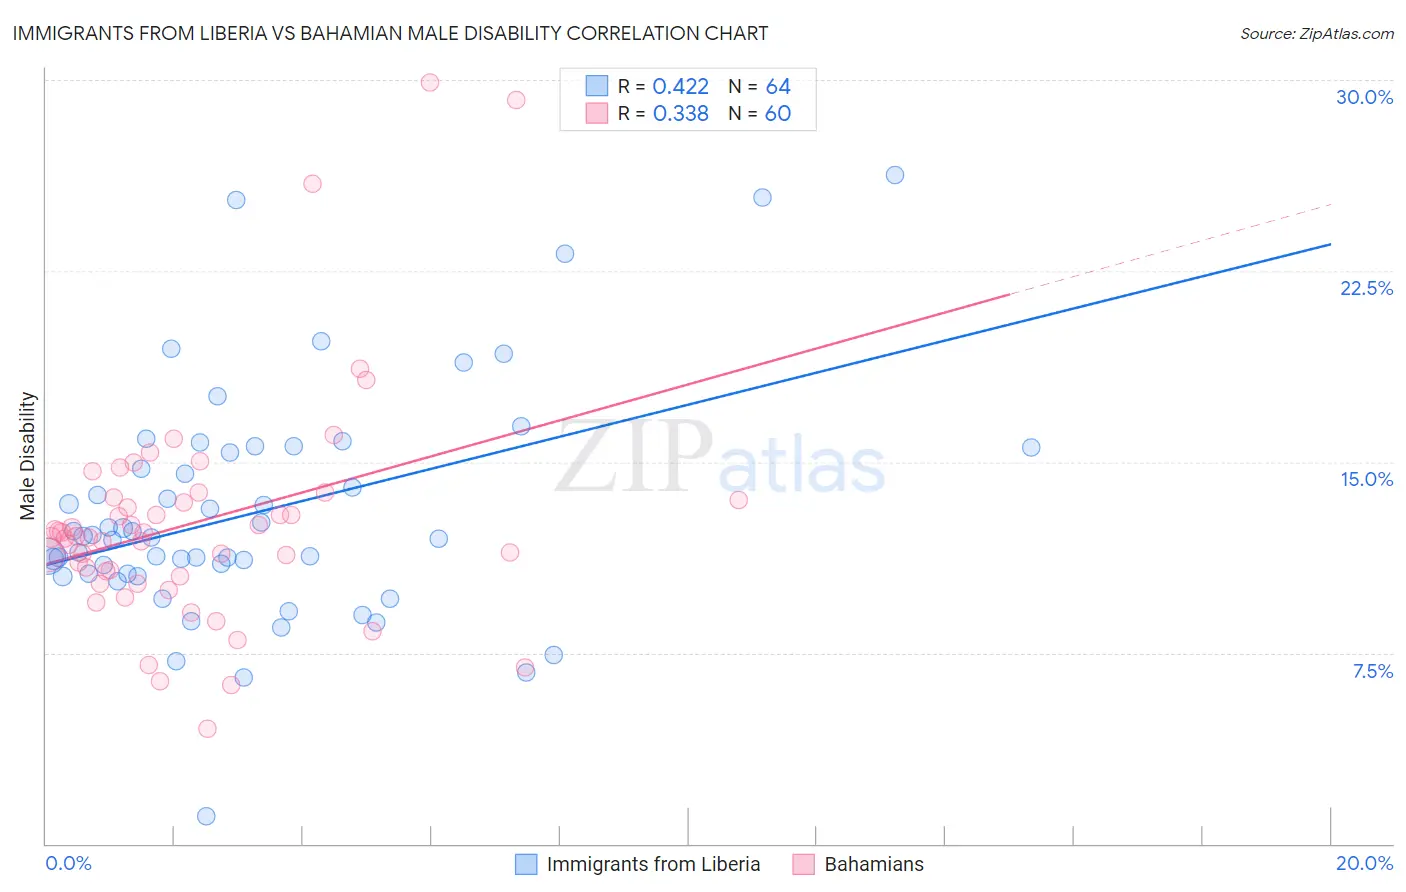
Immigrants from Liberia vs Bahamian Male Disability Correlation Chart
The statistical analysis conducted on geographies consisting of 135,258,288 people shows a moderate positive correlation between the proportion of Immigrants from Liberia and percentage of males with a disability in the United States with a correlation coefficient (R) of 0.422 and weighted average of 11.9%. Similarly, the statistical analysis conducted on geographies consisting of 112,681,735 people shows a mild positive correlation between the proportion of Bahamians and percentage of males with a disability in the United States with a correlation coefficient (R) of 0.338 and weighted average of 11.9%, a difference of 0.16%.
Male Disability Correlation Summary
| Measurement | Immigrants from Liberia | Bahamian |
| Minimum | 1.1% | 4.5% |
| Maximum | 26.3% | 29.9% |
| Range | 25.2% | 25.4% |
| Mean | 13.0% | 12.6% |
| Median | 12.1% | 12.1% |
| Interquartile 25% (IQ1) | 10.6% | 10.6% |
| Interquartile 75% (IQ3) | 15.5% | 13.5% |
| Interquartile Range (IQR) | 4.9% | 2.9% |
| Standard Deviation (Sample) | 4.6% | 4.5% |
| Standard Deviation (Population) | 4.5% | 4.5% |
Demographics Similar to Immigrants from Liberia and Bahamians by Male Disability
In terms of male disability, the demographic groups most similar to Immigrants from Liberia are Immigrants from Laos (11.9%, a difference of 0.0%), Danish (11.9%, a difference of 0.030%), Samoan (11.9%, a difference of 0.12%), Northern European (11.9%, a difference of 0.15%), and Czech (11.9%, a difference of 0.20%). Similarly, the demographic groups most similar to Bahamians are Northern European (11.9%, a difference of 0.010%), Czech (11.9%, a difference of 0.040%), Samoan (11.9%, a difference of 0.040%), Italian (11.9%, a difference of 0.080%), and Yugoslavian (11.9%, a difference of 0.14%).
| Demographics | Rating | Rank | Male Disability |
| Mexicans | 1.7 /100 | #233 | Tragic 11.8% |
| Immigrants | Canada | 1.6 /100 | #234 | Tragic 11.9% |
| Immigrants | North America | 1.5 /100 | #235 | Tragic 11.9% |
| U.S. Virgin Islanders | 1.3 /100 | #236 | Tragic 11.9% |
| Carpatho Rusyns | 1.3 /100 | #237 | Tragic 11.9% |
| Yugoslavians | 1.2 /100 | #238 | Tragic 11.9% |
| Italians | 1.2 /100 | #239 | Tragic 11.9% |
| Czechs | 1.1 /100 | #240 | Tragic 11.9% |
| Bahamians | 1.1 /100 | #241 | Tragic 11.9% |
| Northern Europeans | 1.1 /100 | #242 | Tragic 11.9% |
| Samoans | 1.1 /100 | #243 | Tragic 11.9% |
| Immigrants | Laos | 1.0 /100 | #244 | Tragic 11.9% |
| Immigrants | Liberia | 1.0 /100 | #245 | Tragic 11.9% |
| Danes | 0.9 /100 | #246 | Tragic 11.9% |
| Hungarians | 0.8 /100 | #247 | Tragic 12.0% |
| Poles | 0.7 /100 | #248 | Tragic 12.0% |
| Immigrants | Yemen | 0.5 /100 | #249 | Tragic 12.0% |
| Bangladeshis | 0.5 /100 | #250 | Tragic 12.0% |
| German Russians | 0.5 /100 | #251 | Tragic 12.0% |
| Slovenes | 0.5 /100 | #252 | Tragic 12.0% |
| Guamanians/Chamorros | 0.5 /100 | #253 | Tragic 12.0% |