Luxembourger vs Bahamian Male Disability
COMPARE
Luxembourger
Bahamian
Male Disability
Male Disability Comparison
Luxembourgers
Bahamians
11.1%
MALE DISABILITY
61.9/ 100
METRIC RATING
165th/ 347
METRIC RANK
11.9%
MALE DISABILITY
1.1/ 100
METRIC RATING
241st/ 347
METRIC RANK
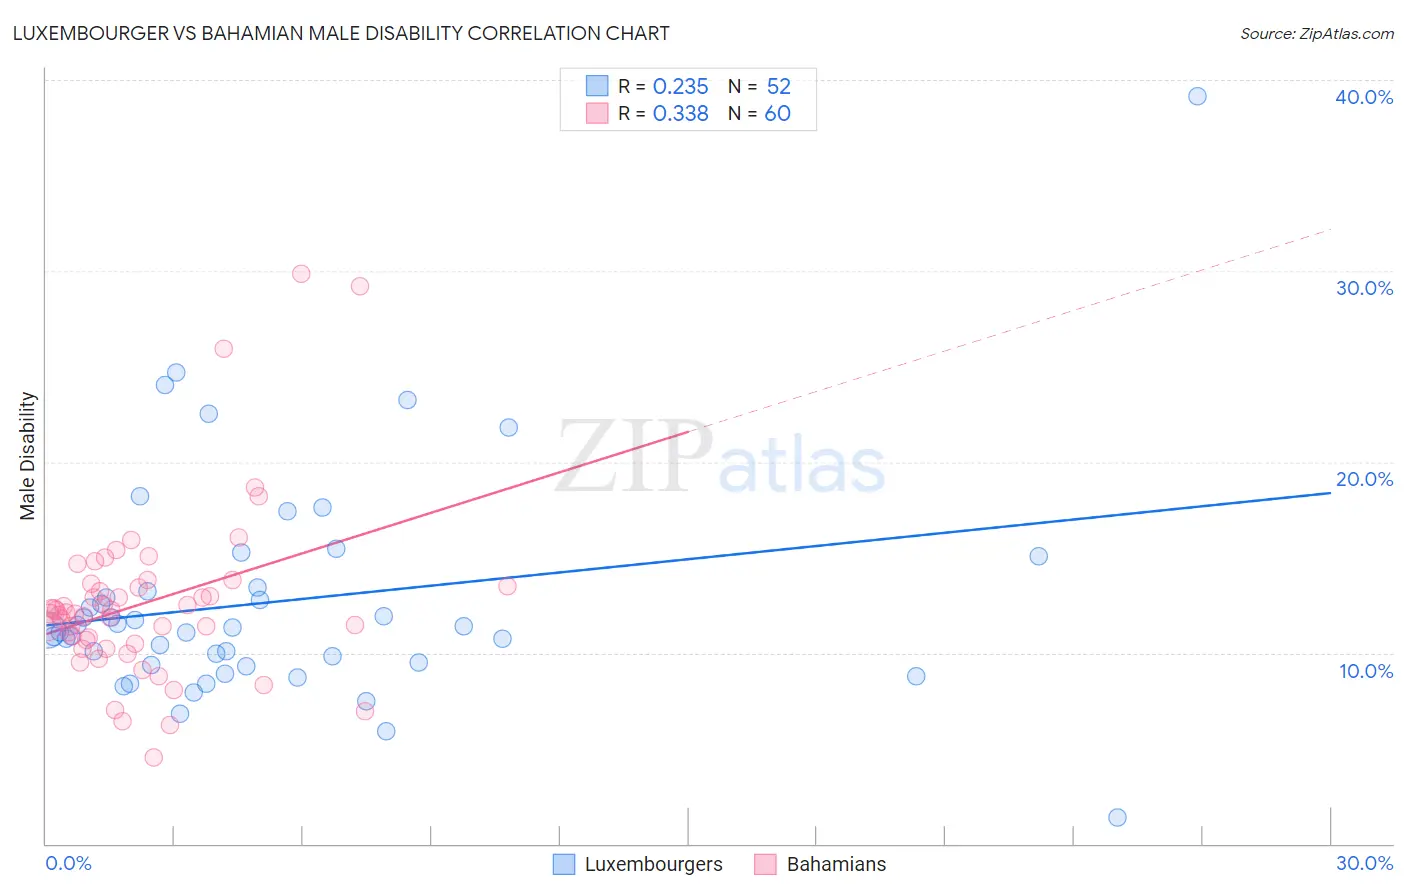
Luxembourger vs Bahamian Male Disability Correlation Chart
The statistical analysis conducted on geographies consisting of 144,678,542 people shows a weak positive correlation between the proportion of Luxembourgers and percentage of males with a disability in the United States with a correlation coefficient (R) of 0.235 and weighted average of 11.1%. Similarly, the statistical analysis conducted on geographies consisting of 112,681,735 people shows a mild positive correlation between the proportion of Bahamians and percentage of males with a disability in the United States with a correlation coefficient (R) of 0.338 and weighted average of 11.9%, a difference of 7.0%.
Male Disability Correlation Summary
| Measurement | Luxembourger | Bahamian |
| Minimum | 1.4% | 4.5% |
| Maximum | 39.1% | 29.9% |
| Range | 37.8% | 25.4% |
| Mean | 12.7% | 12.6% |
| Median | 11.3% | 12.1% |
| Interquartile 25% (IQ1) | 9.4% | 10.6% |
| Interquartile 75% (IQ3) | 13.3% | 13.5% |
| Interquartile Range (IQR) | 3.9% | 2.9% |
| Standard Deviation (Sample) | 6.0% | 4.5% |
| Standard Deviation (Population) | 5.9% | 4.5% |
Similar Demographics by Male Disability
Demographics Similar to Luxembourgers by Male Disability
In terms of male disability, the demographic groups most similar to Luxembourgers are Immigrants from Hungary (11.1%, a difference of 0.040%), British West Indian (11.1%, a difference of 0.050%), Immigrants from Kenya (11.1%, a difference of 0.11%), Immigrants from Haiti (11.1%, a difference of 0.20%), and Immigrants from West Indies (11.1%, a difference of 0.23%).
| Demographics | Rating | Rank | Male Disability |
| Latvians | 68.1 /100 | #158 | Good 11.1% |
| Guatemalans | 67.2 /100 | #159 | Good 11.1% |
| Albanians | 66.5 /100 | #160 | Good 11.1% |
| Immigrants | West Indies | 65.7 /100 | #161 | Good 11.1% |
| Immigrants | Haiti | 65.3 /100 | #162 | Good 11.1% |
| Immigrants | Kenya | 63.8 /100 | #163 | Good 11.1% |
| British West Indians | 62.8 /100 | #164 | Good 11.1% |
| Luxembourgers | 61.9 /100 | #165 | Good 11.1% |
| Immigrants | Hungary | 61.2 /100 | #166 | Good 11.1% |
| Immigrants | Southern Europe | 54.4 /100 | #167 | Average 11.2% |
| Immigrants | Latin America | 54.0 /100 | #168 | Average 11.2% |
| Barbadians | 53.4 /100 | #169 | Average 11.2% |
| New Zealanders | 52.9 /100 | #170 | Average 11.2% |
| Haitians | 52.5 /100 | #171 | Average 11.2% |
| Romanians | 50.7 /100 | #172 | Average 11.2% |
Demographics Similar to Bahamians by Male Disability
In terms of male disability, the demographic groups most similar to Bahamians are Northern European (11.9%, a difference of 0.010%), Czech (11.9%, a difference of 0.040%), Samoan (11.9%, a difference of 0.040%), Italian (11.9%, a difference of 0.080%), and Yugoslavian (11.9%, a difference of 0.14%).
| Demographics | Rating | Rank | Male Disability |
| Immigrants | Canada | 1.6 /100 | #234 | Tragic 11.9% |
| Immigrants | North America | 1.5 /100 | #235 | Tragic 11.9% |
| U.S. Virgin Islanders | 1.3 /100 | #236 | Tragic 11.9% |
| Carpatho Rusyns | 1.3 /100 | #237 | Tragic 11.9% |
| Yugoslavians | 1.2 /100 | #238 | Tragic 11.9% |
| Italians | 1.2 /100 | #239 | Tragic 11.9% |
| Czechs | 1.1 /100 | #240 | Tragic 11.9% |
| Bahamians | 1.1 /100 | #241 | Tragic 11.9% |
| Northern Europeans | 1.1 /100 | #242 | Tragic 11.9% |
| Samoans | 1.1 /100 | #243 | Tragic 11.9% |
| Immigrants | Laos | 1.0 /100 | #244 | Tragic 11.9% |
| Immigrants | Liberia | 1.0 /100 | #245 | Tragic 11.9% |
| Danes | 0.9 /100 | #246 | Tragic 11.9% |
| Hungarians | 0.8 /100 | #247 | Tragic 12.0% |
| Poles | 0.7 /100 | #248 | Tragic 12.0% |