Immigrants from Liberia vs Bahamian Unemployment Among Ages 45 to 54 years
COMPARE
Immigrants from Liberia
Bahamian
Unemployment Among Ages 45 to 54 years
Unemployment Among Ages 45 to 54 years Comparison
Immigrants from Liberia
Bahamians
4.8%
UNEMPLOYMENT AMONG AGES 45 TO 54 YEARS
0.8/ 100
METRIC RATING
248th/ 347
METRIC RANK
4.9%
UNEMPLOYMENT AMONG AGES 45 TO 54 YEARS
0.0/ 100
METRIC RATING
267th/ 347
METRIC RANK
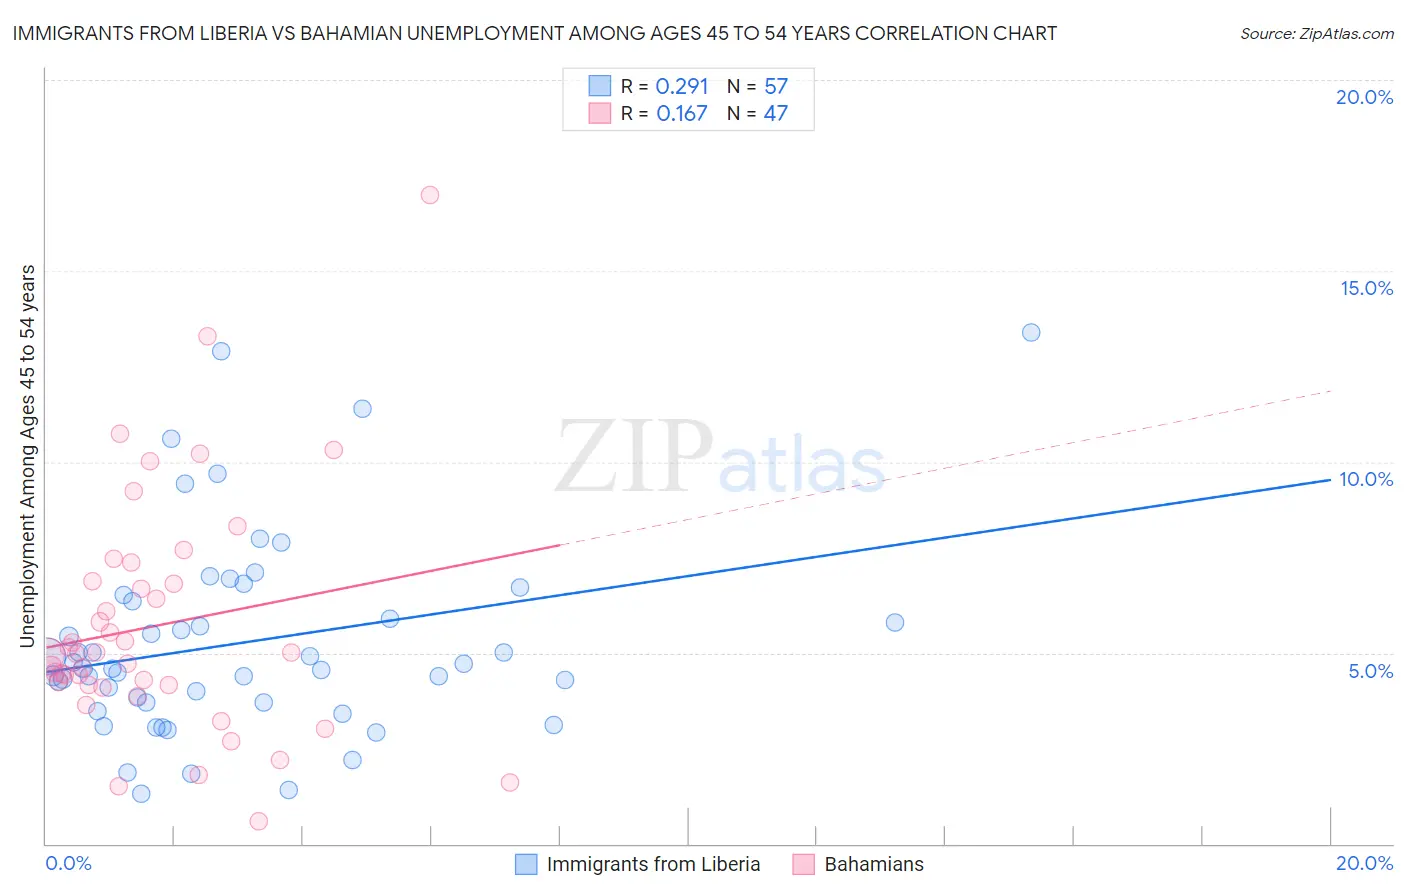
Immigrants from Liberia vs Bahamian Unemployment Among Ages 45 to 54 years Correlation Chart
The statistical analysis conducted on geographies consisting of 134,368,611 people shows a weak positive correlation between the proportion of Immigrants from Liberia and unemployment rate among population between the ages 45 and 54 in the United States with a correlation coefficient (R) of 0.291 and weighted average of 4.8%. Similarly, the statistical analysis conducted on geographies consisting of 111,522,631 people shows a poor positive correlation between the proportion of Bahamians and unemployment rate among population between the ages 45 and 54 in the United States with a correlation coefficient (R) of 0.167 and weighted average of 4.9%, a difference of 3.3%.
Unemployment Among Ages 45 to 54 years Correlation Summary
| Measurement | Immigrants from Liberia | Bahamian |
| Minimum | 1.3% | 0.60% |
| Maximum | 13.4% | 17.0% |
| Range | 12.1% | 16.4% |
| Mean | 5.3% | 5.7% |
| Median | 4.6% | 5.0% |
| Interquartile 25% (IQ1) | 3.7% | 4.1% |
| Interquartile 75% (IQ3) | 6.4% | 6.9% |
| Interquartile Range (IQR) | 2.7% | 2.7% |
| Standard Deviation (Sample) | 2.6% | 3.1% |
| Standard Deviation (Population) | 2.6% | 3.1% |
Demographics Similar to Immigrants from Liberia and Bahamians by Unemployment Among Ages 45 to 54 years
In terms of unemployment among ages 45 to 54 years, the demographic groups most similar to Immigrants from Liberia are Israeli (4.8%, a difference of 0.11%), Immigrants from Honduras (4.8%, a difference of 0.17%), Salvadoran (4.8%, a difference of 0.24%), Honduran (4.8%, a difference of 0.70%), and Immigrants from Bahamas (4.8%, a difference of 0.94%). Similarly, the demographic groups most similar to Bahamians are Ghanaian (4.9%, a difference of 0.090%), Immigrants from Somalia (4.9%, a difference of 0.21%), Immigrants from Guatemala (4.9%, a difference of 0.48%), Immigrants from Fiji (4.9%, a difference of 0.74%), and Mexican (4.9%, a difference of 1.1%).
| Demographics | Rating | Rank | Unemployment Among Ages 45 to 54 years |
| Israelis | 0.9 /100 | #247 | Tragic 4.8% |
| Immigrants | Liberia | 0.8 /100 | #248 | Tragic 4.8% |
| Immigrants | Honduras | 0.7 /100 | #249 | Tragic 4.8% |
| Salvadorans | 0.7 /100 | #250 | Tragic 4.8% |
| Hondurans | 0.4 /100 | #251 | Tragic 4.8% |
| Immigrants | Bahamas | 0.3 /100 | #252 | Tragic 4.8% |
| Moroccans | 0.3 /100 | #253 | Tragic 4.8% |
| Immigrants | Lebanon | 0.2 /100 | #254 | Tragic 4.8% |
| Immigrants | El Salvador | 0.2 /100 | #255 | Tragic 4.8% |
| Immigrants | Western Asia | 0.2 /100 | #256 | Tragic 4.8% |
| Immigrants | Western Africa | 0.2 /100 | #257 | Tragic 4.9% |
| Sub-Saharan Africans | 0.2 /100 | #258 | Tragic 4.9% |
| Ugandans | 0.1 /100 | #259 | Tragic 4.9% |
| Mexican American Indians | 0.1 /100 | #260 | Tragic 4.9% |
| Guatemalans | 0.1 /100 | #261 | Tragic 4.9% |
| Mexicans | 0.1 /100 | #262 | Tragic 4.9% |
| Immigrants | Fiji | 0.1 /100 | #263 | Tragic 4.9% |
| Immigrants | Guatemala | 0.1 /100 | #264 | Tragic 4.9% |
| Immigrants | Somalia | 0.1 /100 | #265 | Tragic 4.9% |
| Ghanaians | 0.0 /100 | #266 | Tragic 4.9% |
| Bahamians | 0.0 /100 | #267 | Tragic 4.9% |