Immigrants from Korea vs Immigrants from Dominica Male Disability
COMPARE
Immigrants from Korea
Immigrants from Dominica
Male Disability
Male Disability Comparison
Immigrants from Korea
Immigrants from Dominica
9.8%
MALE DISABILITY
100.0/ 100
METRIC RATING
17th/ 347
METRIC RANK
11.7%
MALE DISABILITY
4.6/ 100
METRIC RATING
217th/ 347
METRIC RANK
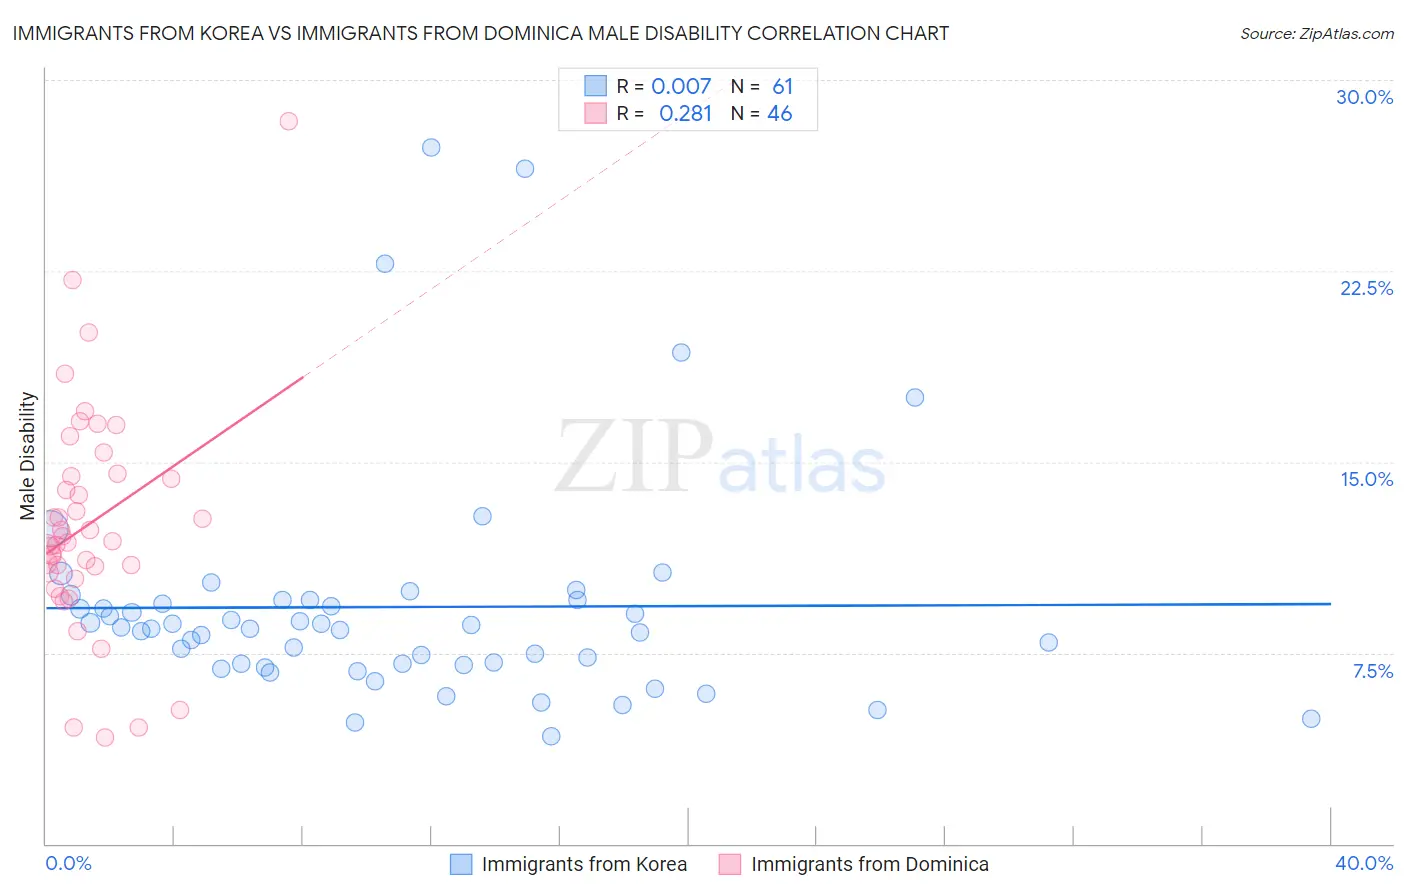
Immigrants from Korea vs Immigrants from Dominica Male Disability Correlation Chart
The statistical analysis conducted on geographies consisting of 416,248,293 people shows no correlation between the proportion of Immigrants from Korea and percentage of males with a disability in the United States with a correlation coefficient (R) of 0.007 and weighted average of 9.8%. Similarly, the statistical analysis conducted on geographies consisting of 83,789,752 people shows a weak positive correlation between the proportion of Immigrants from Dominica and percentage of males with a disability in the United States with a correlation coefficient (R) of 0.281 and weighted average of 11.7%, a difference of 19.4%.
Male Disability Correlation Summary
| Measurement | Immigrants from Korea | Immigrants from Dominica |
| Minimum | 4.2% | 4.2% |
| Maximum | 27.3% | 28.4% |
| Range | 23.1% | 24.2% |
| Mean | 9.3% | 12.5% |
| Median | 8.5% | 11.9% |
| Interquartile 25% (IQ1) | 7.0% | 10.6% |
| Interquartile 75% (IQ3) | 9.6% | 14.4% |
| Interquartile Range (IQR) | 2.5% | 3.8% |
| Standard Deviation (Sample) | 4.5% | 4.4% |
| Standard Deviation (Population) | 4.5% | 4.4% |
Similar Demographics by Male Disability
Demographics Similar to Immigrants from Korea by Male Disability
In terms of male disability, the demographic groups most similar to Immigrants from Korea are Okinawan (9.8%, a difference of 0.14%), Immigrants from Pakistan (9.8%, a difference of 0.56%), Indian (Asian) (9.7%, a difference of 0.75%), Immigrants from Iran (9.7%, a difference of 1.2%), and Iranian (9.7%, a difference of 1.3%).
| Demographics | Rating | Rank | Male Disability |
| Immigrants | Israel | 100.0 /100 | #10 | Exceptional 9.6% |
| Immigrants | Eastern Asia | 100.0 /100 | #11 | Exceptional 9.6% |
| Bolivians | 100.0 /100 | #12 | Exceptional 9.6% |
| Iranians | 100.0 /100 | #13 | Exceptional 9.7% |
| Immigrants | Iran | 100.0 /100 | #14 | Exceptional 9.7% |
| Indians (Asian) | 100.0 /100 | #15 | Exceptional 9.7% |
| Okinawans | 100.0 /100 | #16 | Exceptional 9.8% |
| Immigrants | Korea | 100.0 /100 | #17 | Exceptional 9.8% |
| Immigrants | Pakistan | 100.0 /100 | #18 | Exceptional 9.8% |
| Immigrants | Sri Lanka | 100.0 /100 | #19 | Exceptional 10.0% |
| Asians | 100.0 /100 | #20 | Exceptional 10.0% |
| Burmese | 100.0 /100 | #21 | Exceptional 10.0% |
| Immigrants | Venezuela | 100.0 /100 | #22 | Exceptional 10.0% |
| Cypriots | 100.0 /100 | #23 | Exceptional 10.0% |
| Immigrants | Asia | 100.0 /100 | #24 | Exceptional 10.0% |
Demographics Similar to Immigrants from Dominica by Male Disability
In terms of male disability, the demographic groups most similar to Immigrants from Dominica are Immigrants from Dominican Republic (11.7%, a difference of 0.070%), Immigrants from England (11.7%, a difference of 0.21%), Panamanian (11.7%, a difference of 0.27%), Immigrants from Western Europe (11.7%, a difference of 0.28%), and Immigrants from Congo (11.7%, a difference of 0.29%).
| Demographics | Rating | Rank | Male Disability |
| Ute | 9.4 /100 | #210 | Tragic 11.6% |
| Immigrants | Thailand | 8.4 /100 | #211 | Tragic 11.6% |
| Immigrants | Scotland | 8.2 /100 | #212 | Tragic 11.6% |
| Mexican American Indians | 7.8 /100 | #213 | Tragic 11.6% |
| Lithuanians | 6.6 /100 | #214 | Tragic 11.6% |
| Indonesians | 5.9 /100 | #215 | Tragic 11.6% |
| Immigrants | Dominican Republic | 4.9 /100 | #216 | Tragic 11.7% |
| Immigrants | Dominica | 4.6 /100 | #217 | Tragic 11.7% |
| Immigrants | England | 4.0 /100 | #218 | Tragic 11.7% |
| Panamanians | 3.8 /100 | #219 | Tragic 11.7% |
| Immigrants | Western Europe | 3.8 /100 | #220 | Tragic 11.7% |
| Immigrants | Congo | 3.7 /100 | #221 | Tragic 11.7% |
| Alsatians | 3.3 /100 | #222 | Tragic 11.7% |
| Immigrants | Bahamas | 3.2 /100 | #223 | Tragic 11.7% |
| Japanese | 3.1 /100 | #224 | Tragic 11.7% |