Immigrants from Korea vs Colville Disability Age 5 to 17

COMPARE

Immigrants from Korea
Race
Ancestry
AfghanAfricanAlaska NativeAlaskan AthabascanAlbanianAleutAlsatianAmericanApacheArabArapahoArgentineanArmenianAssyrian/Chaldean/SyriacAustralianAustrianBahamianBangladeshiBarbadianBasqueBelgianBelizeanBermudanBhutaneseBlackfeetBolivianBrazilianBritishBritish West IndianBulgarianBurmeseCajunCambodianCanadianCape VerdeanCarpatho RusynCelticCentral AmericanCentral American IndianCherokeeCheyenneChickasawChileanChineseChippewaChoctawColombianComancheCosta RicanCreeCreekCroatianCrowCubanCypriotCzechCzechoslovakianDanishDelawareDominicanDutchDutch West IndianEastern EuropeanEcuadorianEgyptianEnglishEstonianEthiopianEuropeanFijianFilipinoFinnishFrenchFrench American IndianFrench CanadianGermanGerman RussianGhanaianGreekGuamanian/ChamorroGuatemalanGuyaneseHaitianHmongHonduranHopiHoumaHungarianIcelanderIndian (Asian)IndonesianInupiatIranianIraqiIrishIroquoisIsraeliItalianJamaicanJapaneseJordanianKenyanKiowaKoreanLaotianLatvianLebaneseLiberianLithuanianLumbeeLuxembourgerMacedonianMalaysianMalteseMarshalleseMenomineeMexicanMexican American IndianMongolianMoroccanNative HawaiianNavajoNepaleseNew ZealanderNicaraguanNigerianNorthern EuropeanNorwegianOkinawanOsageOttawaPaiutePakistaniPalestinianPanamanianParaguayanPennsylvania GermanPeruvianPimaPolishPortuguesePotawatomiPuebloPuerto RicanPuget Sound SalishRomanianRussianSalvadoranSamoanScandinavianScotch-IrishScottishSeminoleSenegaleseSerbianShoshoneSierra LeoneanSiouxSlavicSlovakSloveneSomaliSouth AfricanSouth AmericanSouth American IndianSoviet UnionSpaniardSpanishSpanish AmericanSpanish American IndianSri LankanSubsaharan AfricanSudaneseSwedishSwissSyrianTaiwaneseThaiTlingit-HaidaTohono O'OdhamTonganTrinidadian and TobagonianTsimshianTurkishU.S. Virgin IslanderUgandanUkrainianUruguayanUteVenezuelanVietnameseWelshWest IndianYakamaYaquiYugoslavianYumanYup'ikZimbabwean
Immigration
NonimmigrantsImmigrantsAfghanistanAfricaAlbaniaArgentinaArmeniaAsiaAustraliaAustriaBahamasBangladeshBarbadosBelarusBelgiumBelizeBoliviaBosnia and HerzegovinaBrazilBulgariaBurma/MyanmarCabo VerdeCambodiaCameroonCanadaCaribbeanCentral AmericaChileChinaColombiaCongoCosta RicaCroatiaCubaCzechoslovakiaDenmarkDominicaDominican RepublicEastern AfricaEastern AsiaEastern EuropeEcuadorEgyptEl SalvadorEnglandEritreaEthiopiaEuropeFijiFranceGermanyGhanaGreeceGrenadaGuatemalaGuyanaHaitiHondurasHong KongHungaryIndiaIndonesiaIranIraqIrelandIsraelItalyJamaicaJapanJordanKazakhstanKenyaKoreaKuwaitLaosLatin AmericaLatviaLebanonLiberiaLithuaniaMalaysiaMexicoMicronesiaMiddle AfricaMoldovaMoroccoNepalNetherlandsNicaraguaNigeriaNorth AmericaNorth MacedoniaNorthern AfricaNorthern EuropeNorwayOceaniaPakistanPanamaPeruPhilippinesPolandPortugalRomaniaRussiaSaudi ArabiaScotlandSenegalSerbiaSierra LeoneSingaporeSomaliaSouth AfricaSouth AmericaSouth Central AsiaSouth Eastern AsiaSouthern EuropeSpainSri LankaSt. Vincent and the GrenadinesSudanSwedenSwitzerlandSyriaTaiwanThailandTrinidad and TobagoTurkeyUgandaUkraineUruguayUzbekistanVenezuelaVietnamWest IndiesWestern AfricaWestern AsiaWestern EuropeYemenZaireZimbabweAzores
Colville
Race
Ancestry
AfghanAfricanAlaska NativeAlaskan AthabascanAlbanianAleutAlsatianAmericanApacheArabArapahoArgentineanArmenianAssyrian/Chaldean/SyriacAustralianAustrianBahamianBangladeshiBarbadianBasqueBelgianBelizeanBermudanBhutaneseBlackfeetBolivianBrazilianBritishBritish West IndianBulgarianBurmeseCajunCambodianCanadianCape VerdeanCarpatho RusynCelticCentral AmericanCentral American IndianCherokeeCheyenneChickasawChileanChineseChippewaChoctawColombianColvilleComancheCosta RicanCreeCreekCroatianCrowCubanCypriotCzechCzechoslovakianDanishDelawareDominicanDutchDutch West IndianEastern EuropeanEcuadorianEgyptianEnglishEstonianEthiopianEuropeanFijianFilipinoFinnishFrenchFrench American IndianFrench CanadianGermanGerman RussianGhanaianGreekGuamanian/ChamorroGuatemalanGuyaneseHaitianHmongHonduranHopiHoumaHungarianIcelanderIndian (Asian)IndonesianInupiatIranianIraqiIrishIroquoisIsraeliItalianJamaicanJapaneseJordanianKenyanKiowaKoreanLaotianLatvianLebaneseLiberianLithuanianLumbeeLuxembourgerMacedonianMalaysianMalteseMarshalleseMenomineeMexicanMexican American IndianMongolianMoroccanNative HawaiianNavajoNepaleseNew ZealanderNicaraguanNigerianNorthern EuropeanNorwegianOkinawanOsageOttawaPaiutePakistaniPalestinianPanamanianParaguayanPennsylvania GermanPeruvianPimaPolishPortuguesePotawatomiPuebloPuerto RicanPuget Sound SalishRomanianRussianSalvadoranSamoanScandinavianScotch-IrishScottishSeminoleSenegaleseSerbianShoshoneSierra LeoneanSiouxSlavicSlovakSloveneSomaliSouth AfricanSouth AmericanSouth American IndianSoviet UnionSpaniardSpanishSpanish AmericanSpanish American IndianSri LankanSubsaharan AfricanSudaneseSwedishSwissSyrianTaiwaneseThaiTlingit-HaidaTohono O'OdhamTonganTrinidadian and TobagonianTsimshianTurkishU.S. Virgin IslanderUgandanUkrainianUruguayanUteVenezuelanVietnameseWelshWest IndianYakamaYaquiYugoslavianYumanYup'ikZimbabwean
Immigration
NonimmigrantsImmigrantsAfghanistanAfricaAlbaniaArgentinaArmeniaAsiaAustraliaAustriaBahamasBangladeshBarbadosBelarusBelgiumBelizeBoliviaBosnia and HerzegovinaBrazilBulgariaBurma/MyanmarCabo VerdeCambodiaCameroonCanadaCaribbeanCentral AmericaChileChinaColombiaCongoCosta RicaCroatiaCubaCzechoslovakiaDenmarkDominicaDominican RepublicEastern AfricaEastern AsiaEastern EuropeEcuadorEgyptEl SalvadorEnglandEritreaEthiopiaEuropeFijiFranceGermanyGhanaGreeceGrenadaGuatemalaGuyanaHaitiHondurasHong KongHungaryIndiaIndonesiaIranIraqIrelandIsraelItalyJamaicaJapanJordanKazakhstanKenyaKuwaitLaosLatin AmericaLatviaLebanonLiberiaLithuaniaMalaysiaMexicoMicronesiaMiddle AfricaMoldovaMoroccoNepalNetherlandsNicaraguaNigeriaNorth AmericaNorth MacedoniaNorthern AfricaNorthern EuropeNorwayOceaniaPakistanPanamaPeruPhilippinesPolandPortugalRomaniaRussiaSaudi ArabiaScotlandSenegalSerbiaSierra LeoneSingaporeSomaliaSouth AfricaSouth AmericaSouth Central AsiaSouth Eastern AsiaSouthern EuropeSpainSri LankaSt. Vincent and the GrenadinesSudanSwedenSwitzerlandSyriaTaiwanThailandTrinidad and TobagoTurkeyUgandaUkraineUruguayUzbekistanVenezuelaVietnamWest IndiesWestern AfricaWestern AsiaWestern EuropeYemenZaireZimbabweAzores
Disability Age 5 to 17
Income
Poverty
Unemployment
Labor Participation
Family Structure
Vehicle Availability
Education Level
Disability

Disability Age 5 to 17 Comparison

Immigrants from Korea

Colville

Exceptional
Tragic
4.7%
DISABILITY AGE 5 TO 17
100.0/ 100
METRIC RATING
14th/ 347
METRIC RANK
6.2%
DISABILITY AGE 5 TO 17
0.0/ 100
METRIC RATING
286th/ 347
METRIC RANK

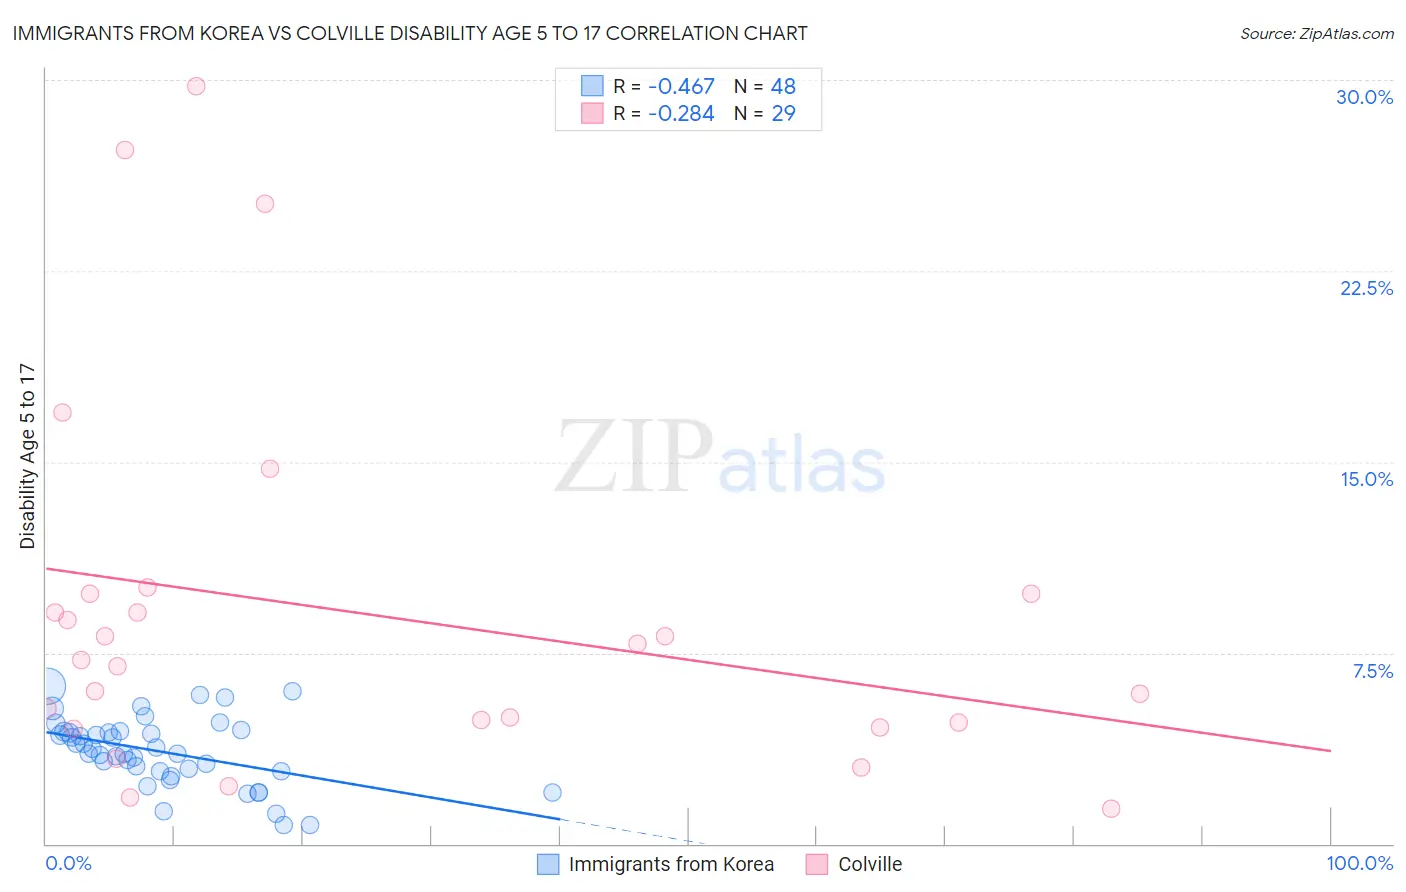
Immigrants from Korea vs Colville Disability Age 5 to 17 Correlation Chart

The statistical analysis conducted on geographies consisting of 412,408,030 people shows a moderate negative correlation between the proportion of Immigrants from Korea and percentage of population with a disability between the ages 5 and 17 in the United States with a correlation coefficient (R) of -0.467 and weighted average of 4.7%. Similarly, the statistical analysis conducted on geographies consisting of 34,647,331 people shows a weak negative correlation between the proportion of Colville and percentage of population with a disability between the ages 5 and 17 in the United States with a correlation coefficient (R) of -0.284 and weighted average of 6.2%, a difference of 31.5%.
Immigrants from Korea vs Colville Disability Age 5 to 17

Disability Age 5 to 17 Correlation Summary

MeasurementImmigrants from KoreaColville
Minimum0.73%1.4%
Maximum6.2%29.8%
Range5.4%28.4%
Mean3.6%9.0%
Median3.6%7.2%
Interquartile 25% (IQ1)2.9%4.7%
Interquartile 75% (IQ3)4.4%9.8%
Interquartile Range (IQR)1.5%5.2%
Standard Deviation (Sample)1.3%7.3%
Standard Deviation (Population)1.3%7.1%

Similar Demographics by Disability Age 5 to 17

Demographics Similar to Immigrants from Korea by Disability Age 5 to 17

In terms of disability age 5 to 17, the demographic groups most similar to Immigrants from Korea are Chinese (4.7%, a difference of 0.20%), Immigrants from Singapore (4.7%, a difference of 0.63%), Thai (4.7%, a difference of 0.70%), Arapaho (4.7%, a difference of 1.1%), and Immigrants from South Central Asia (4.7%, a difference of 1.1%).
DemographicsRating | RankDisability Age 5 to 17
Immigrants | China
100.0
/100
|
#7
Exceptional
4.5%
Indians (Asian)
100.0
/100
|
#8
Exceptional
4.6%
Immigrants | Eastern Asia
100.0
/100
|
#9
Exceptional
4.6%
Immigrants | India
100.0
/100
|
#10
Exceptional
4.6%
Armenians
100.0
/100
|
#11
Exceptional
4.6%
Iranians
100.0
/100
|
#12
Exceptional
4.6%
Thais
100.0
/100
|
#13
Exceptional
4.7%
Immigrants | Korea
100.0
/100
|
#14
Exceptional
4.7%
Chinese
100.0
/100
|
#15
Exceptional
4.7%
Immigrants | Singapore
100.0
/100
|
#16
Exceptional
4.7%
Arapaho
100.0
/100
|
#17
Exceptional
4.7%
Immigrants | South Central Asia
100.0
/100
|
#18
Exceptional
4.7%
Immigrants | Uzbekistan
100.0
/100
|
#19
Exceptional
4.8%
Burmese
100.0
/100
|
#20
Exceptional
4.8%
Yup'ik
100.0
/100
|
#21
Exceptional
4.8%

Demographics Similar to Colville by Disability Age 5 to 17

In terms of disability age 5 to 17, the demographic groups most similar to Colville are Subsaharan African (6.2%, a difference of 0.040%), English (6.2%, a difference of 0.040%), Ugandan (6.2%, a difference of 0.070%), Pima (6.2%, a difference of 0.19%), and German (6.1%, a difference of 0.23%).
DemographicsRating | RankDisability Age 5 to 17
Immigrants | Jamaica
0.1
/100
|
#279
Tragic
6.1%
Portuguese
0.1
/100
|
#280
Tragic
6.1%
Scottish
0.0
/100
|
#281
Tragic
6.1%
Germans
0.0
/100
|
#282
Tragic
6.1%
Ugandans
0.0
/100
|
#283
Tragic
6.2%
Sub-Saharan Africans
0.0
/100
|
#284
Tragic
6.2%
English
0.0
/100
|
#285
Tragic
6.2%
Colville
0.0
/100
|
#286
Tragic
6.2%
Pima
0.0
/100
|
#287
Tragic
6.2%
Jamaicans
0.0
/100
|
#288
Tragic
6.2%
Yaqui
0.0
/100
|
#289
Tragic
6.2%
Immigrants | Congo
0.0
/100
|
#290
Tragic
6.2%
Whites/Caucasians
0.0
/100
|
#291
Tragic
6.2%
Immigrants | Senegal
0.0
/100
|
#292
Tragic
6.2%
Central American Indians
0.0
/100
|
#293
Tragic
6.2%