Spanish vs Bahamian Disability Age Over 75
COMPARE
Spanish
Bahamian
Disability Age Over 75
Disability Age Over 75 Comparison
Spanish
Bahamians
48.0%
DISABILITY AGE OVER 75
6.5/ 100
METRIC RATING
225th/ 347
METRIC RANK
48.0%
DISABILITY AGE OVER 75
7.4/ 100
METRIC RATING
220th/ 347
METRIC RANK
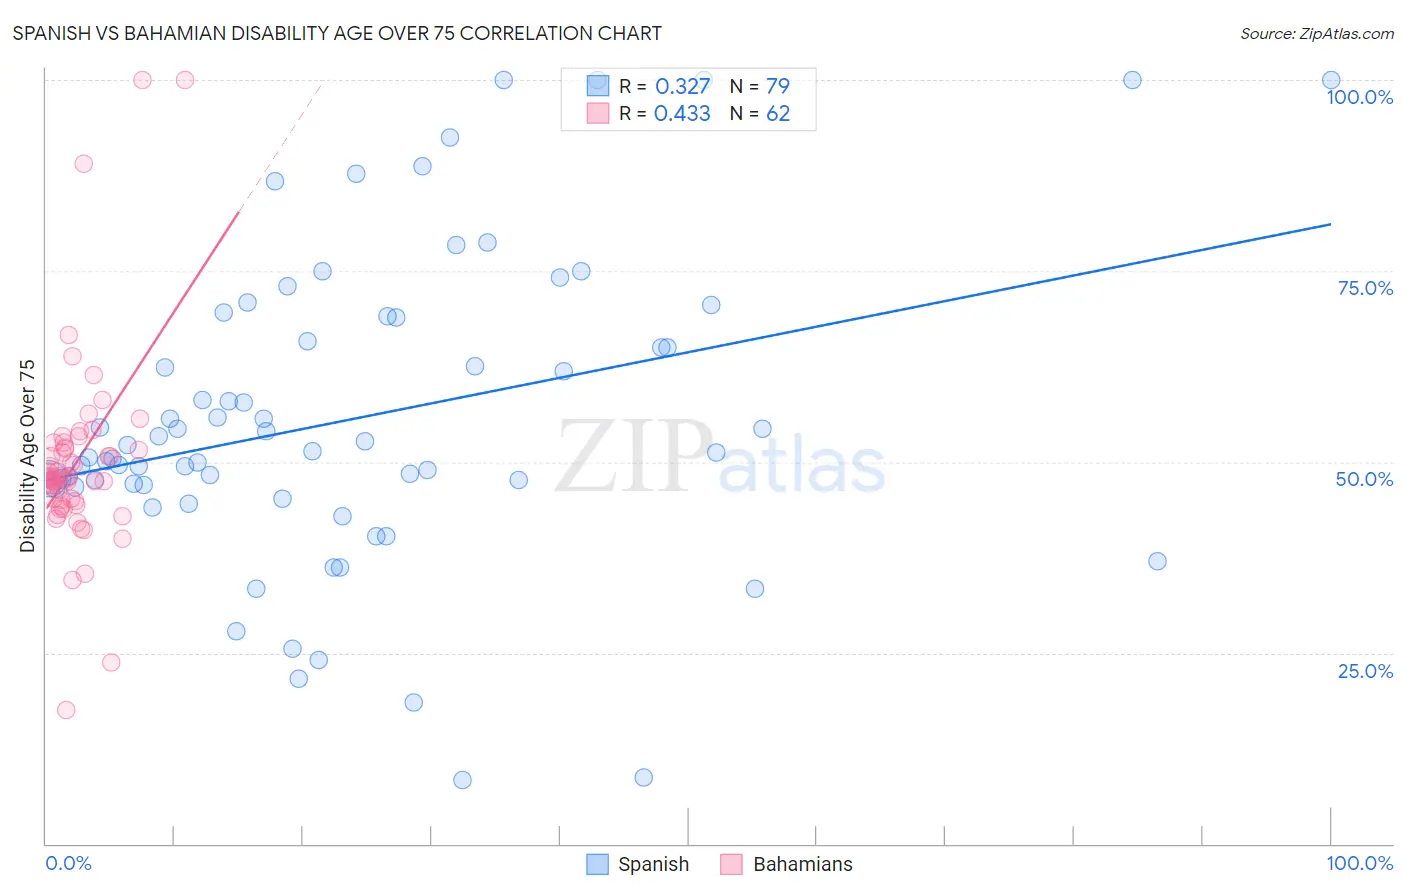
Spanish vs Bahamian Disability Age Over 75 Correlation Chart
The statistical analysis conducted on geographies consisting of 421,400,354 people shows a mild positive correlation between the proportion of Spanish and percentage of population with a disability over the age of 75 in the United States with a correlation coefficient (R) of 0.327 and weighted average of 48.0%. Similarly, the statistical analysis conducted on geographies consisting of 112,565,508 people shows a moderate positive correlation between the proportion of Bahamians and percentage of population with a disability over the age of 75 in the United States with a correlation coefficient (R) of 0.433 and weighted average of 48.0%, a difference of 0.070%.
Disability Age Over 75 Correlation Summary
| Measurement | Spanish | Bahamian |
| Minimum | 8.3% | 17.5% |
| Maximum | 100.0% | 100.0% |
| Range | 91.7% | 82.5% |
| Mean | 55.7% | 50.0% |
| Median | 51.3% | 48.0% |
| Interquartile 25% (IQ1) | 46.7% | 44.9% |
| Interquartile 75% (IQ3) | 68.9% | 51.8% |
| Interquartile Range (IQR) | 22.2% | 6.9% |
| Standard Deviation (Sample) | 20.3% | 13.0% |
| Standard Deviation (Population) | 20.1% | 12.9% |
Demographics Similar to Spanish and Bahamians by Disability Age Over 75
In terms of disability age over 75, the demographic groups most similar to Spanish are Liberian (48.0%, a difference of 0.010%), Nonimmigrants (48.0%, a difference of 0.010%), Zimbabwean (48.1%, a difference of 0.010%), Immigrants from Bangladesh (48.0%, a difference of 0.020%), and Barbadian (48.0%, a difference of 0.030%). Similarly, the demographic groups most similar to Bahamians are Immigrants from Western Asia (48.0%, a difference of 0.010%), Immigrants from Oceania (48.0%, a difference of 0.010%), Barbadian (48.0%, a difference of 0.050%), Immigrants from Bangladesh (48.0%, a difference of 0.050%), and Liberian (48.0%, a difference of 0.060%).
| Demographics | Rating | Rank | Disability Age Over 75 |
| Immigrants | Burma/Myanmar | 11.7 /100 | #212 | Poor 47.9% |
| Laotians | 11.5 /100 | #213 | Poor 47.9% |
| Immigrants | Barbados | 10.7 /100 | #214 | Poor 47.9% |
| Senegalese | 10.7 /100 | #215 | Poor 47.9% |
| Immigrants | Panama | 10.2 /100 | #216 | Poor 47.9% |
| Immigrants | Grenada | 9.4 /100 | #217 | Tragic 47.9% |
| Immigrants | Western Africa | 8.3 /100 | #218 | Tragic 48.0% |
| Immigrants | Western Asia | 7.5 /100 | #219 | Tragic 48.0% |
| Bahamians | 7.4 /100 | #220 | Tragic 48.0% |
| Immigrants | Oceania | 7.3 /100 | #221 | Tragic 48.0% |
| Barbadians | 6.8 /100 | #222 | Tragic 48.0% |
| Immigrants | Bangladesh | 6.8 /100 | #223 | Tragic 48.0% |
| Liberians | 6.7 /100 | #224 | Tragic 48.0% |
| Spanish | 6.5 /100 | #225 | Tragic 48.0% |
| Immigrants | Nonimmigrants | 6.5 /100 | #226 | Tragic 48.0% |
| Zimbabweans | 6.4 /100 | #227 | Tragic 48.1% |
| Immigrants | Liberia | 5.9 /100 | #228 | Tragic 48.1% |
| Spaniards | 5.7 /100 | #229 | Tragic 48.1% |
| Taiwanese | 4.4 /100 | #230 | Tragic 48.2% |
| Immigrants | Immigrants | 4.3 /100 | #231 | Tragic 48.2% |
| Indonesians | 4.2 /100 | #232 | Tragic 48.2% |