Immigrants from Kenya vs Trinidadian and Tobagonian Disability Age 35 to 64
COMPARE
Immigrants from Kenya
Trinidadian and Tobagonian
Disability Age 35 to 64
Disability Age 35 to 64 Comparison
Immigrants from Kenya
Trinidadians and Tobagonians
11.6%
DISABILITY AGE 35 TO 64
17.7/ 100
METRIC RATING
201st/ 347
METRIC RANK
11.4%
DISABILITY AGE 35 TO 64
40.8/ 100
METRIC RATING
181st/ 347
METRIC RANK
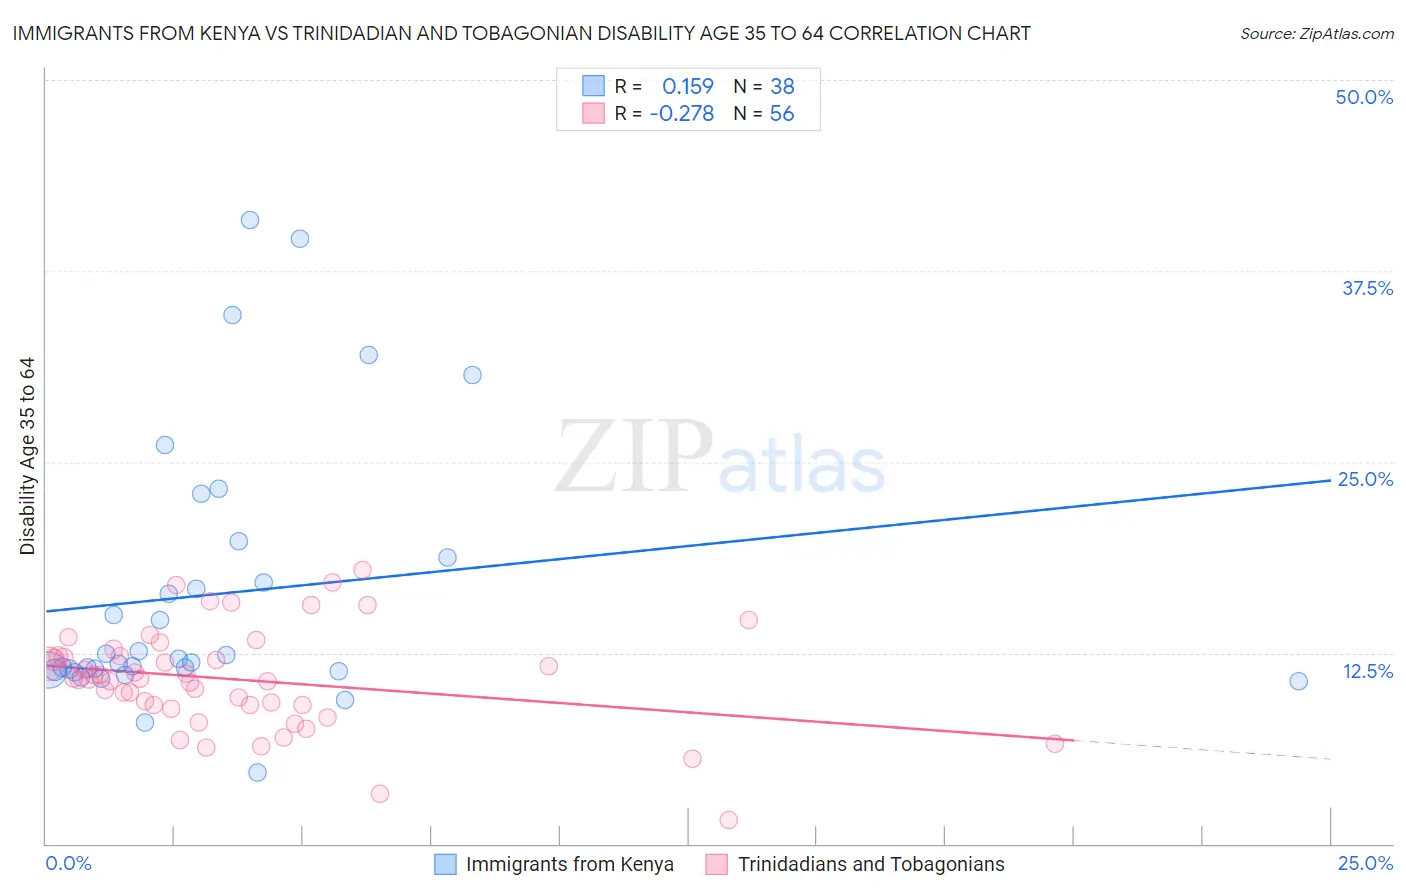
Immigrants from Kenya vs Trinidadian and Tobagonian Disability Age 35 to 64 Correlation Chart
The statistical analysis conducted on geographies consisting of 217,981,041 people shows a poor positive correlation between the proportion of Immigrants from Kenya and percentage of population with a disability between the ages 34 and 64 in the United States with a correlation coefficient (R) of 0.159 and weighted average of 11.6%. Similarly, the statistical analysis conducted on geographies consisting of 219,688,298 people shows a weak negative correlation between the proportion of Trinidadians and Tobagonians and percentage of population with a disability between the ages 34 and 64 in the United States with a correlation coefficient (R) of -0.278 and weighted average of 11.4%, a difference of 2.3%.
Disability Age 35 to 64 Correlation Summary
| Measurement | Immigrants from Kenya | Trinidadian and Tobagonian |
| Minimum | 4.6% | 1.6% |
| Maximum | 40.9% | 17.9% |
| Range | 36.2% | 16.3% |
| Mean | 16.3% | 10.8% |
| Median | 12.0% | 10.8% |
| Interquartile 25% (IQ1) | 11.4% | 9.1% |
| Interquartile 75% (IQ3) | 18.8% | 12.3% |
| Interquartile Range (IQR) | 7.4% | 3.2% |
| Standard Deviation (Sample) | 8.8% | 3.3% |
| Standard Deviation (Population) | 8.7% | 3.3% |
Demographics Similar to Immigrants from Kenya and Trinidadians and Tobagonians by Disability Age 35 to 64
In terms of disability age 35 to 64, the demographic groups most similar to Immigrants from Kenya are Swiss (11.6%, a difference of 0.13%), Basque (11.6%, a difference of 0.23%), Immigrants from Panama (11.6%, a difference of 0.34%), Immigrants from Iraq (11.6%, a difference of 0.42%), and Iraqi (11.5%, a difference of 0.78%). Similarly, the demographic groups most similar to Trinidadians and Tobagonians are Icelander (11.4%, a difference of 0.090%), Immigrants from Oceania (11.4%, a difference of 0.10%), Kenyan (11.4%, a difference of 0.13%), Danish (11.4%, a difference of 0.33%), and Slovene (11.4%, a difference of 0.35%).
| Demographics | Rating | Rank | Disability Age 35 to 64 |
| Trinidadians and Tobagonians | 40.8 /100 | #181 | Average 11.4% |
| Icelanders | 39.7 /100 | #182 | Fair 11.4% |
| Immigrants | Oceania | 39.5 /100 | #183 | Fair 11.4% |
| Kenyans | 39.2 /100 | #184 | Fair 11.4% |
| Danes | 36.8 /100 | #185 | Fair 11.4% |
| Slovenes | 36.6 /100 | #186 | Fair 11.4% |
| Immigrants | Bosnia and Herzegovina | 35.2 /100 | #187 | Fair 11.4% |
| Northern Europeans | 34.9 /100 | #188 | Fair 11.4% |
| Hungarians | 34.6 /100 | #189 | Fair 11.4% |
| Immigrants | Nigeria | 32.5 /100 | #190 | Fair 11.4% |
| Swedes | 31.3 /100 | #191 | Fair 11.4% |
| Norwegians | 29.7 /100 | #192 | Fair 11.5% |
| Immigrants | Africa | 29.0 /100 | #193 | Fair 11.5% |
| Immigrants | Latin America | 27.5 /100 | #194 | Fair 11.5% |
| Carpatho Rusyns | 25.3 /100 | #195 | Fair 11.5% |
| Iraqis | 24.2 /100 | #196 | Fair 11.5% |
| Immigrants | Iraq | 21.0 /100 | #197 | Fair 11.6% |
| Immigrants | Panama | 20.4 /100 | #198 | Fair 11.6% |
| Basques | 19.5 /100 | #199 | Poor 11.6% |
| Swiss | 18.7 /100 | #200 | Poor 11.6% |
| Immigrants | Kenya | 17.7 /100 | #201 | Poor 11.6% |