Immigrants from Italy vs Salvadoran Disability Age 65 to 74
COMPARE
Immigrants from Italy
Salvadoran
Disability Age 65 to 74
Disability Age 65 to 74 Comparison
Immigrants from Italy
Salvadorans
21.5%
DISABILITY AGE 65 TO 74
99.6/ 100
METRIC RATING
54th/ 347
METRIC RANK
25.0%
DISABILITY AGE 65 TO 74
0.8/ 100
METRIC RATING
250th/ 347
METRIC RANK
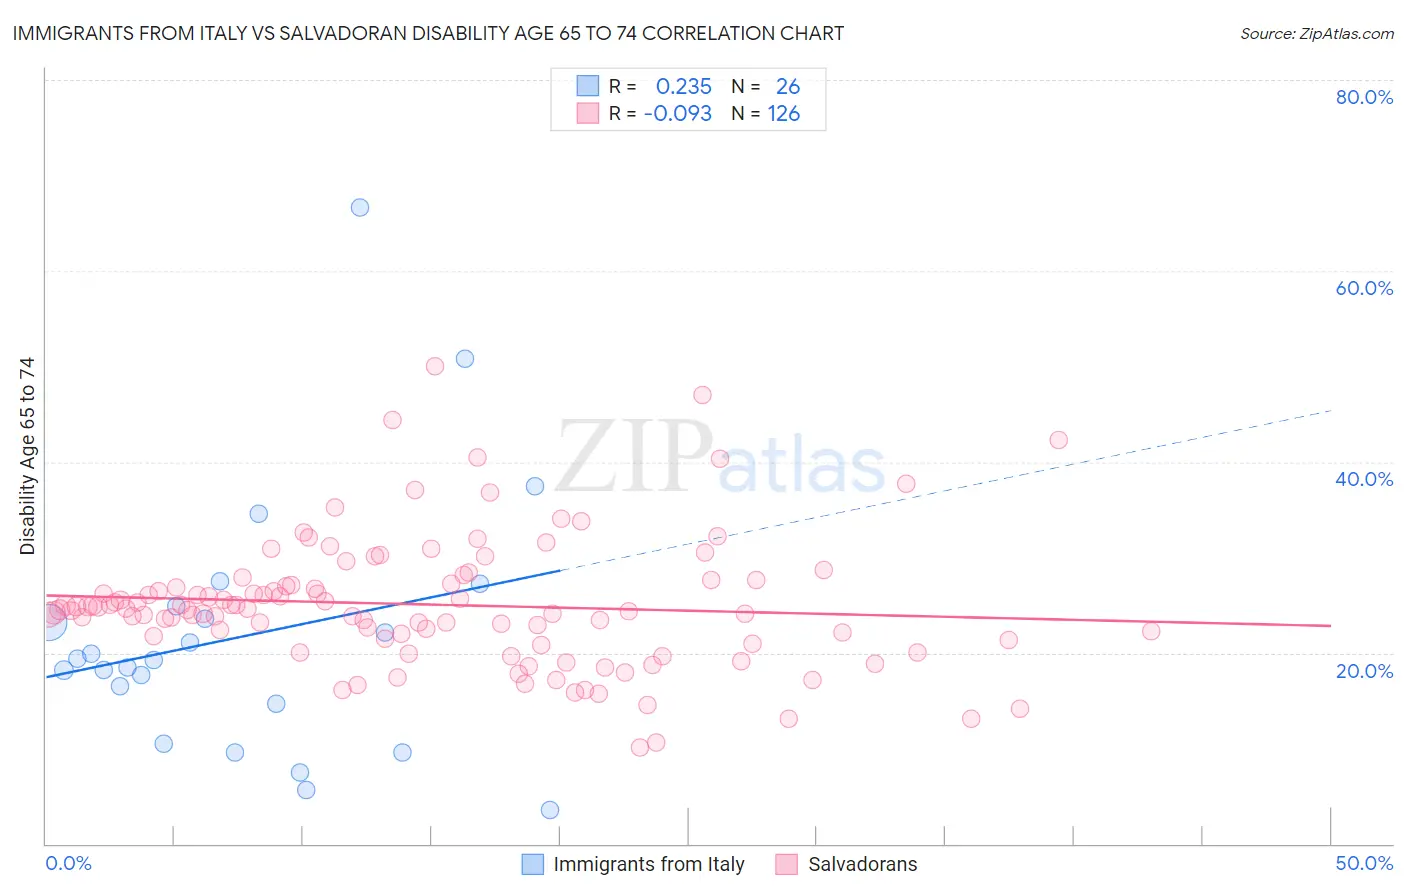
Immigrants from Italy vs Salvadoran Disability Age 65 to 74 Correlation Chart
The statistical analysis conducted on geographies consisting of 323,882,260 people shows a weak positive correlation between the proportion of Immigrants from Italy and percentage of population with a disability between the ages 65 and 75 in the United States with a correlation coefficient (R) of 0.235 and weighted average of 21.5%. Similarly, the statistical analysis conducted on geographies consisting of 398,038,040 people shows a slight negative correlation between the proportion of Salvadorans and percentage of population with a disability between the ages 65 and 75 in the United States with a correlation coefficient (R) of -0.093 and weighted average of 25.0%, a difference of 16.2%.
Disability Age 65 to 74 Correlation Summary
| Measurement | Immigrants from Italy | Salvadoran |
| Minimum | 3.5% | 10.1% |
| Maximum | 66.7% | 50.0% |
| Range | 63.2% | 39.9% |
| Mean | 21.8% | 25.1% |
| Median | 19.3% | 24.5% |
| Interquartile 25% (IQ1) | 14.7% | 21.5% |
| Interquartile 75% (IQ3) | 24.9% | 27.2% |
| Interquartile Range (IQR) | 10.2% | 5.7% |
| Standard Deviation (Sample) | 13.7% | 6.8% |
| Standard Deviation (Population) | 13.5% | 6.8% |
Similar Demographics by Disability Age 65 to 74
Demographics Similar to Immigrants from Italy by Disability Age 65 to 74
In terms of disability age 65 to 74, the demographic groups most similar to Immigrants from Italy are Bhutanese (21.5%, a difference of 0.010%), Immigrants from France (21.5%, a difference of 0.020%), Immigrants from Romania (21.5%, a difference of 0.080%), Immigrants from Denmark (21.5%, a difference of 0.10%), and Immigrants from Asia (21.5%, a difference of 0.19%).
| Demographics | Rating | Rank | Disability Age 65 to 74 |
| Immigrants | Bulgaria | 99.7 /100 | #47 | Exceptional 21.4% |
| Lithuanians | 99.7 /100 | #48 | Exceptional 21.4% |
| Luxembourgers | 99.7 /100 | #49 | Exceptional 21.4% |
| Immigrants | Malaysia | 99.7 /100 | #50 | Exceptional 21.4% |
| Immigrants | Serbia | 99.6 /100 | #51 | Exceptional 21.4% |
| Immigrants | France | 99.6 /100 | #52 | Exceptional 21.5% |
| Bhutanese | 99.6 /100 | #53 | Exceptional 21.5% |
| Immigrants | Italy | 99.6 /100 | #54 | Exceptional 21.5% |
| Immigrants | Romania | 99.5 /100 | #55 | Exceptional 21.5% |
| Immigrants | Denmark | 99.5 /100 | #56 | Exceptional 21.5% |
| Immigrants | Asia | 99.5 /100 | #57 | Exceptional 21.5% |
| Immigrants | Pakistan | 99.5 /100 | #58 | Exceptional 21.5% |
| Zimbabweans | 99.5 /100 | #59 | Exceptional 21.5% |
| Immigrants | North Macedonia | 99.5 /100 | #60 | Exceptional 21.6% |
| Egyptians | 99.5 /100 | #61 | Exceptional 21.6% |
Demographics Similar to Salvadorans by Disability Age 65 to 74
In terms of disability age 65 to 74, the demographic groups most similar to Salvadorans are Immigrants from Fiji (25.0%, a difference of 0.020%), Senegalese (24.9%, a difference of 0.12%), Nonimmigrants (25.0%, a difference of 0.20%), Indonesian (24.9%, a difference of 0.37%), and Immigrants from El Salvador (25.1%, a difference of 0.39%).
| Demographics | Rating | Rank | Disability Age 65 to 74 |
| Spanish | 2.2 /100 | #243 | Tragic 24.6% |
| Armenians | 2.0 /100 | #244 | Tragic 24.7% |
| British West Indians | 2.0 /100 | #245 | Tragic 24.7% |
| Immigrants | Iraq | 1.9 /100 | #246 | Tragic 24.7% |
| Indonesians | 1.1 /100 | #247 | Tragic 24.9% |
| Senegalese | 0.9 /100 | #248 | Tragic 24.9% |
| Immigrants | Fiji | 0.8 /100 | #249 | Tragic 25.0% |
| Salvadorans | 0.8 /100 | #250 | Tragic 25.0% |
| Immigrants | Nonimmigrants | 0.7 /100 | #251 | Tragic 25.0% |
| Immigrants | El Salvador | 0.6 /100 | #252 | Tragic 25.1% |
| Sub-Saharan Africans | 0.6 /100 | #253 | Tragic 25.1% |
| Somalis | 0.6 /100 | #254 | Tragic 25.1% |
| Central Americans | 0.5 /100 | #255 | Tragic 25.1% |
| Immigrants | Somalia | 0.4 /100 | #256 | Tragic 25.2% |
| Guamanians/Chamorros | 0.3 /100 | #257 | Tragic 25.3% |