Immigrants from Italy vs Salvadoran Unemployment Among Ages 16 to 19 years
COMPARE
Immigrants from Italy
Salvadoran
Unemployment Among Ages 16 to 19 years
Unemployment Among Ages 16 to 19 years Comparison
Immigrants from Italy
Salvadorans
17.5%
UNEMPLOYMENT AMONG AGES 16 TO 19 YEARS
55.2/ 100
METRIC RATING
166th/ 347
METRIC RANK
18.9%
UNEMPLOYMENT AMONG AGES 16 TO 19 YEARS
0.1/ 100
METRIC RATING
262nd/ 347
METRIC RANK
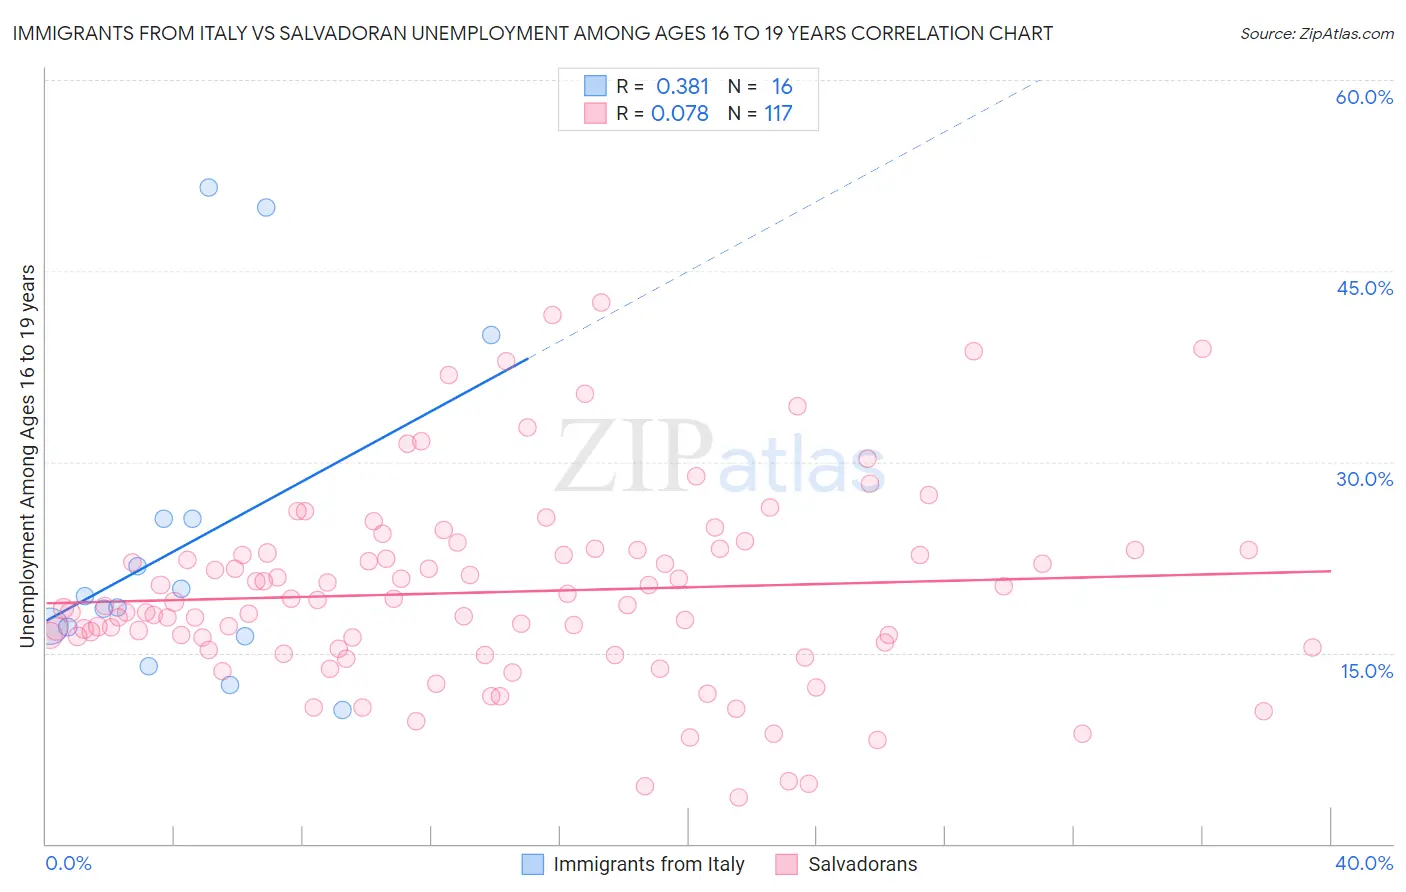
Immigrants from Italy vs Salvadoran Unemployment Among Ages 16 to 19 years Correlation Chart
The statistical analysis conducted on geographies consisting of 308,031,907 people shows a mild positive correlation between the proportion of Immigrants from Italy and unemployment rate among population between the ages 16 and 19 in the United States with a correlation coefficient (R) of 0.381 and weighted average of 17.5%. Similarly, the statistical analysis conducted on geographies consisting of 380,157,558 people shows a slight positive correlation between the proportion of Salvadorans and unemployment rate among population between the ages 16 and 19 in the United States with a correlation coefficient (R) of 0.078 and weighted average of 18.9%, a difference of 8.0%.
Unemployment Among Ages 16 to 19 years Correlation Summary
| Measurement | Immigrants from Italy | Salvadoran |
| Minimum | 10.5% | 3.6% |
| Maximum | 51.6% | 42.5% |
| Range | 41.1% | 38.9% |
| Mean | 23.6% | 19.8% |
| Median | 19.0% | 18.7% |
| Interquartile 25% (IQ1) | 16.7% | 15.4% |
| Interquartile 75% (IQ3) | 25.5% | 23.1% |
| Interquartile Range (IQR) | 8.9% | 7.7% |
| Standard Deviation (Sample) | 12.6% | 7.6% |
| Standard Deviation (Population) | 12.2% | 7.6% |
Similar Demographics by Unemployment Among Ages 16 to 19 years
Demographics Similar to Immigrants from Italy by Unemployment Among Ages 16 to 19 years
In terms of unemployment among ages 16 to 19 years, the demographic groups most similar to Immigrants from Italy are Immigrants from France (17.5%, a difference of 0.020%), Immigrants from Hungary (17.5%, a difference of 0.020%), Cape Verdean (17.5%, a difference of 0.030%), Immigrants from Cambodia (17.5%, a difference of 0.040%), and Immigrants from Romania (17.5%, a difference of 0.090%).
| Demographics | Rating | Rank | Unemployment Among Ages 16 to 19 years |
| Koreans | 61.0 /100 | #159 | Good 17.5% |
| Ukrainians | 60.5 /100 | #160 | Good 17.5% |
| Immigrants | Denmark | 60.3 /100 | #161 | Good 17.5% |
| Immigrants | Norway | 59.8 /100 | #162 | Average 17.5% |
| Egyptians | 59.7 /100 | #163 | Average 17.5% |
| Immigrants | Austria | 57.7 /100 | #164 | Average 17.5% |
| Cape Verdeans | 55.8 /100 | #165 | Average 17.5% |
| Immigrants | Italy | 55.2 /100 | #166 | Average 17.5% |
| Immigrants | France | 54.9 /100 | #167 | Average 17.5% |
| Immigrants | Hungary | 54.7 /100 | #168 | Average 17.5% |
| Immigrants | Cambodia | 54.5 /100 | #169 | Average 17.5% |
| Immigrants | Romania | 53.3 /100 | #170 | Average 17.5% |
| Immigrants | Switzerland | 53.2 /100 | #171 | Average 17.5% |
| Immigrants | Western Europe | 52.2 /100 | #172 | Average 17.6% |
| Chileans | 50.8 /100 | #173 | Average 17.6% |
Demographics Similar to Salvadorans by Unemployment Among Ages 16 to 19 years
In terms of unemployment among ages 16 to 19 years, the demographic groups most similar to Salvadorans are Spanish American Indian (18.9%, a difference of 0.040%), Nigerian (18.9%, a difference of 0.080%), Cree (19.0%, a difference of 0.13%), Immigrants from Central America (18.9%, a difference of 0.16%), and Yaqui (19.0%, a difference of 0.16%).
| Demographics | Rating | Rank | Unemployment Among Ages 16 to 19 years |
| Immigrants | Cameroon | 0.3 /100 | #255 | Tragic 18.8% |
| Mexican American Indians | 0.3 /100 | #256 | Tragic 18.8% |
| Immigrants | Nigeria | 0.2 /100 | #257 | Tragic 18.9% |
| Immigrants | Mexico | 0.2 /100 | #258 | Tragic 18.9% |
| Immigrants | Central America | 0.2 /100 | #259 | Tragic 18.9% |
| Nigerians | 0.2 /100 | #260 | Tragic 18.9% |
| Spanish American Indians | 0.1 /100 | #261 | Tragic 18.9% |
| Salvadorans | 0.1 /100 | #262 | Tragic 18.9% |
| Cree | 0.1 /100 | #263 | Tragic 19.0% |
| Yaqui | 0.1 /100 | #264 | Tragic 19.0% |
| Choctaw | 0.1 /100 | #265 | Tragic 19.0% |
| Immigrants | Honduras | 0.1 /100 | #266 | Tragic 19.0% |
| Israelis | 0.1 /100 | #267 | Tragic 19.0% |
| Immigrants | El Salvador | 0.1 /100 | #268 | Tragic 19.1% |
| Lumbee | 0.1 /100 | #269 | Tragic 19.1% |