Immigrants from Italy vs Immigrants from Argentina Cognitive Disability
COMPARE
Immigrants from Italy
Immigrants from Argentina
Cognitive Disability
Cognitive Disability Comparison
Immigrants from Italy
Immigrants from Argentina
16.5%
COGNITIVE DISABILITY
99.8/ 100
METRIC RATING
47th/ 347
METRIC RANK
16.4%
COGNITIVE DISABILITY
99.9/ 100
METRIC RATING
24th/ 347
METRIC RANK
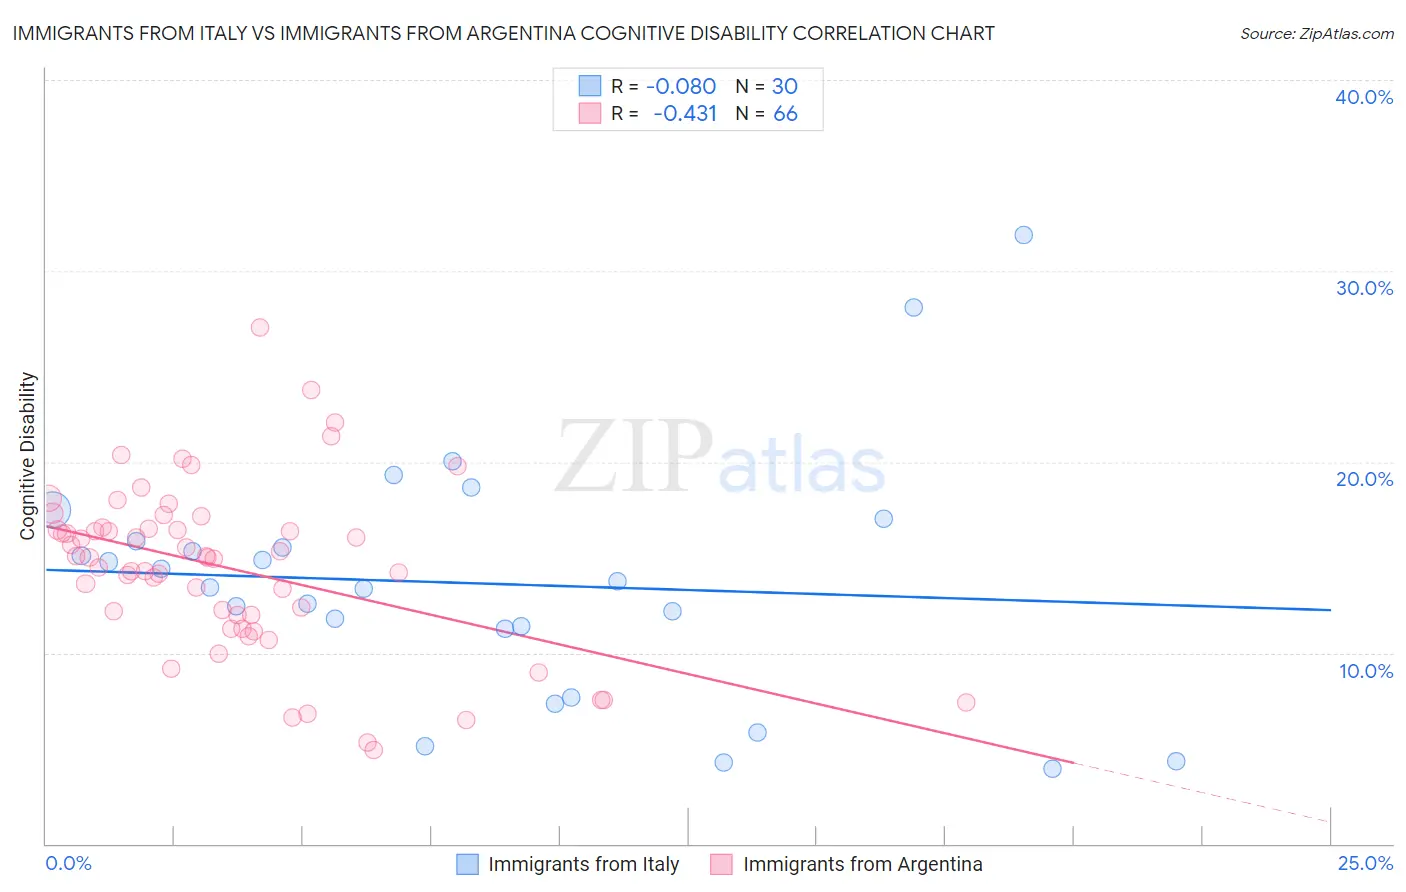
Immigrants from Italy vs Immigrants from Argentina Cognitive Disability Correlation Chart
The statistical analysis conducted on geographies consisting of 324,202,765 people shows a slight negative correlation between the proportion of Immigrants from Italy and percentage of population with cognitive disability in the United States with a correlation coefficient (R) of -0.080 and weighted average of 16.5%. Similarly, the statistical analysis conducted on geographies consisting of 264,433,945 people shows a moderate negative correlation between the proportion of Immigrants from Argentina and percentage of population with cognitive disability in the United States with a correlation coefficient (R) of -0.431 and weighted average of 16.4%, a difference of 0.77%.
Cognitive Disability Correlation Summary
| Measurement | Immigrants from Italy | Immigrants from Argentina |
| Minimum | 3.9% | 4.9% |
| Maximum | 31.9% | 27.0% |
| Range | 27.9% | 22.1% |
| Mean | 13.6% | 14.4% |
| Median | 13.6% | 15.0% |
| Interquartile 25% (IQ1) | 11.3% | 11.9% |
| Interquartile 75% (IQ3) | 15.9% | 16.5% |
| Interquartile Range (IQR) | 4.6% | 4.6% |
| Standard Deviation (Sample) | 6.4% | 4.4% |
| Standard Deviation (Population) | 6.3% | 4.4% |
Similar Demographics by Cognitive Disability
Demographics Similar to Immigrants from Italy by Cognitive Disability
In terms of cognitive disability, the demographic groups most similar to Immigrants from Italy are Immigrants from North America (16.5%, a difference of 0.0%), Immigrants from Colombia (16.5%, a difference of 0.030%), Immigrants from Europe (16.5%, a difference of 0.040%), Iranian (16.5%, a difference of 0.040%), and Macedonian (16.5%, a difference of 0.050%).
| Demographics | Rating | Rank | Cognitive Disability |
| Immigrants | Belarus | 99.9 /100 | #40 | Exceptional 16.5% |
| Cubans | 99.9 /100 | #41 | Exceptional 16.5% |
| Hungarians | 99.9 /100 | #42 | Exceptional 16.5% |
| Immigrants | Canada | 99.8 /100 | #43 | Exceptional 16.5% |
| Macedonians | 99.8 /100 | #44 | Exceptional 16.5% |
| Immigrants | Europe | 99.8 /100 | #45 | Exceptional 16.5% |
| Immigrants | Colombia | 99.8 /100 | #46 | Exceptional 16.5% |
| Immigrants | Italy | 99.8 /100 | #47 | Exceptional 16.5% |
| Immigrants | North America | 99.8 /100 | #48 | Exceptional 16.5% |
| Iranians | 99.8 /100 | #49 | Exceptional 16.5% |
| Norwegians | 99.8 /100 | #50 | Exceptional 16.5% |
| Immigrants | Korea | 99.8 /100 | #51 | Exceptional 16.5% |
| Soviet Union | 99.8 /100 | #52 | Exceptional 16.5% |
| Swedes | 99.8 /100 | #53 | Exceptional 16.5% |
| Immigrants | Iran | 99.8 /100 | #54 | Exceptional 16.5% |
Demographics Similar to Immigrants from Argentina by Cognitive Disability
In terms of cognitive disability, the demographic groups most similar to Immigrants from Argentina are Croatian (16.4%, a difference of 0.030%), Luxembourger (16.4%, a difference of 0.040%), Immigrants from South Central Asia (16.4%, a difference of 0.060%), Immigrants from Croatia (16.4%, a difference of 0.070%), and Immigrants from Pakistan (16.4%, a difference of 0.090%).
| Demographics | Rating | Rank | Cognitive Disability |
| Immigrants | North Macedonia | 100.0 /100 | #17 | Exceptional 16.3% |
| Immigrants | Northern Europe | 100.0 /100 | #18 | Exceptional 16.3% |
| Immigrants | Bolivia | 100.0 /100 | #19 | Exceptional 16.3% |
| Bulgarians | 100.0 /100 | #20 | Exceptional 16.3% |
| Immigrants | Cuba | 100.0 /100 | #21 | Exceptional 16.3% |
| Immigrants | South Central Asia | 99.9 /100 | #22 | Exceptional 16.4% |
| Croatians | 99.9 /100 | #23 | Exceptional 16.4% |
| Immigrants | Argentina | 99.9 /100 | #24 | Exceptional 16.4% |
| Luxembourgers | 99.9 /100 | #25 | Exceptional 16.4% |
| Immigrants | Croatia | 99.9 /100 | #26 | Exceptional 16.4% |
| Immigrants | Pakistan | 99.9 /100 | #27 | Exceptional 16.4% |
| Poles | 99.9 /100 | #28 | Exceptional 16.4% |
| Filipinos | 99.9 /100 | #29 | Exceptional 16.4% |
| Czechs | 99.9 /100 | #30 | Exceptional 16.4% |
| Immigrants | Romania | 99.9 /100 | #31 | Exceptional 16.4% |