Basque vs Jordanian Disability Age Under 5
COMPARE
Basque
Jordanian
Disability Age Under 5
Disability Age Under 5 Comparison
Basques
Jordanians
1.3%
DISABILITY AGE UNDER 5
3.0/ 100
METRIC RATING
237th/ 347
METRIC RANK
1.1%
DISABILITY AGE UNDER 5
98.5/ 100
METRIC RATING
74th/ 347
METRIC RANK
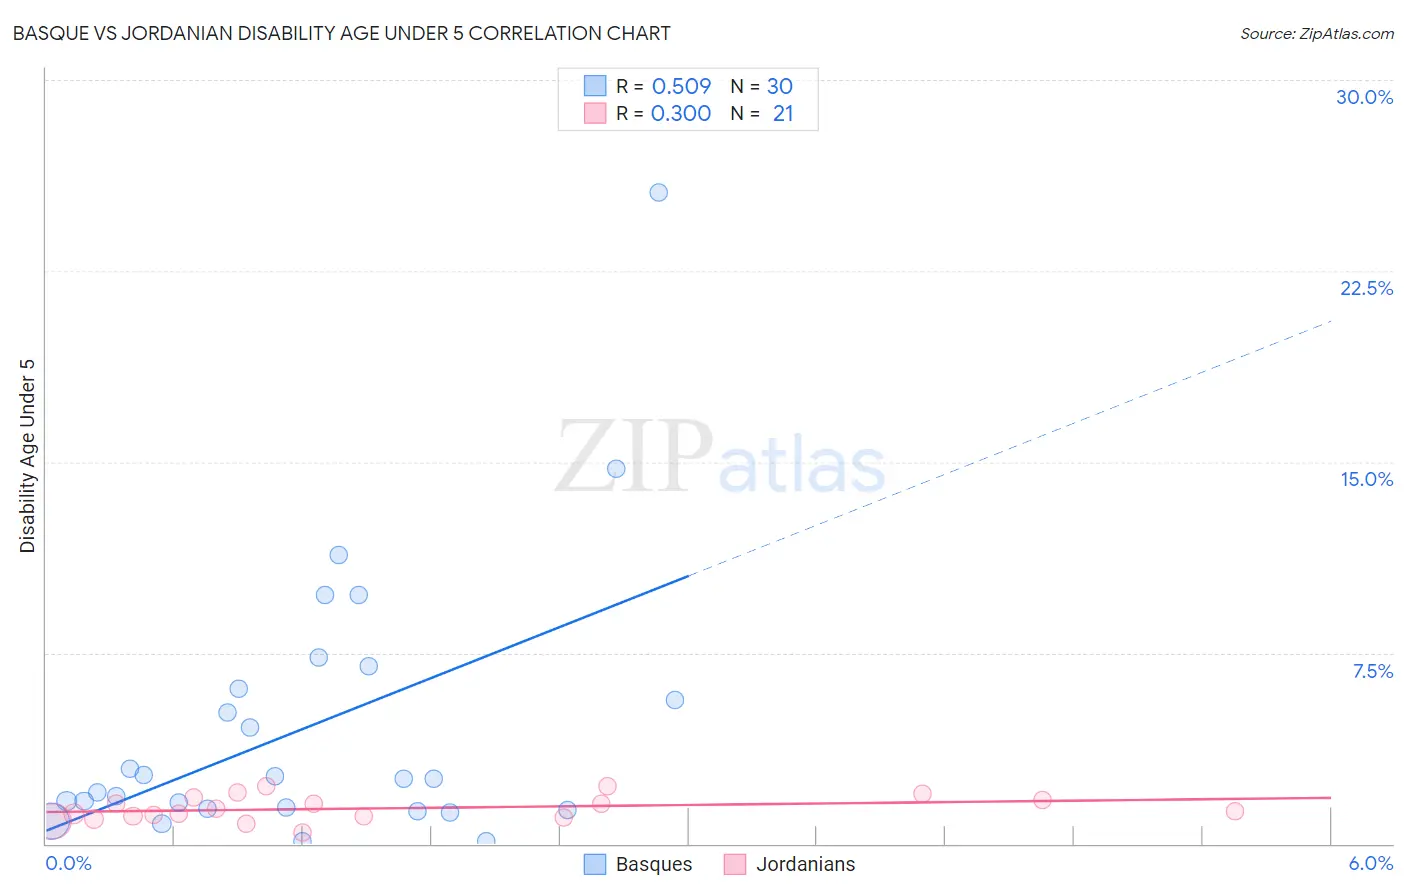
Basque vs Jordanian Disability Age Under 5 Correlation Chart
The statistical analysis conducted on geographies consisting of 115,640,652 people shows a substantial positive correlation between the proportion of Basques and percentage of population with a disability under the age of 5 in the United States with a correlation coefficient (R) of 0.509 and weighted average of 1.3%. Similarly, the statistical analysis conducted on geographies consisting of 116,567,242 people shows a mild positive correlation between the proportion of Jordanians and percentage of population with a disability under the age of 5 in the United States with a correlation coefficient (R) of 0.300 and weighted average of 1.1%, a difference of 19.1%.
Disability Age Under 5 Correlation Summary
| Measurement | Basque | Jordanian |
| Minimum | 0.11% | 0.43% |
| Maximum | 25.6% | 2.2% |
| Range | 25.5% | 1.8% |
| Mean | 4.6% | 1.4% |
| Median | 2.5% | 1.3% |
| Interquartile 25% (IQ1) | 1.4% | 1.1% |
| Interquartile 75% (IQ3) | 6.1% | 1.8% |
| Interquartile Range (IQR) | 4.7% | 0.70% |
| Standard Deviation (Sample) | 5.4% | 0.48% |
| Standard Deviation (Population) | 5.3% | 0.47% |
Similar Demographics by Disability Age Under 5
Demographics Similar to Basques by Disability Age Under 5
In terms of disability age under 5, the demographic groups most similar to Basques are South American Indian (1.3%, a difference of 0.24%), Spanish American Indian (1.3%, a difference of 0.43%), Central American Indian (1.3%, a difference of 0.44%), Pueblo (1.3%, a difference of 0.51%), and Immigrants from Austria (1.3%, a difference of 0.59%).
| Demographics | Rating | Rank | Disability Age Under 5 |
| Lebanese | 5.3 /100 | #230 | Tragic 1.3% |
| Immigrants | Northern Europe | 4.7 /100 | #231 | Tragic 1.3% |
| French American Indians | 4.5 /100 | #232 | Tragic 1.3% |
| Tongans | 4.2 /100 | #233 | Tragic 1.3% |
| Pueblo | 3.8 /100 | #234 | Tragic 1.3% |
| Central American Indians | 3.6 /100 | #235 | Tragic 1.3% |
| South American Indians | 3.3 /100 | #236 | Tragic 1.3% |
| Basques | 3.0 /100 | #237 | Tragic 1.3% |
| Spanish American Indians | 2.4 /100 | #238 | Tragic 1.3% |
| Immigrants | Austria | 2.3 /100 | #239 | Tragic 1.3% |
| Native Hawaiians | 2.2 /100 | #240 | Tragic 1.3% |
| Maltese | 2.2 /100 | #241 | Tragic 1.3% |
| Lumbee | 2.1 /100 | #242 | Tragic 1.3% |
| Immigrants | Cameroon | 1.7 /100 | #243 | Tragic 1.4% |
| Spaniards | 1.4 /100 | #244 | Tragic 1.4% |
Demographics Similar to Jordanians by Disability Age Under 5
In terms of disability age under 5, the demographic groups most similar to Jordanians are Immigrants from Sri Lanka (1.1%, a difference of 0.0%), Burmese (1.1%, a difference of 0.090%), Immigrants from Pakistan (1.1%, a difference of 0.090%), Trinidadian and Tobagonian (1.1%, a difference of 0.25%), and Immigrants from Ecuador (1.1%, a difference of 0.31%).
| Demographics | Rating | Rank | Disability Age Under 5 |
| Immigrants | Belize | 98.7 /100 | #67 | Exceptional 1.1% |
| South Africans | 98.7 /100 | #68 | Exceptional 1.1% |
| Israelis | 98.7 /100 | #69 | Exceptional 1.1% |
| Immigrants | Ecuador | 98.6 /100 | #70 | Exceptional 1.1% |
| Trinidadians and Tobagonians | 98.6 /100 | #71 | Exceptional 1.1% |
| Burmese | 98.5 /100 | #72 | Exceptional 1.1% |
| Immigrants | Sri Lanka | 98.5 /100 | #73 | Exceptional 1.1% |
| Jordanians | 98.5 /100 | #74 | Exceptional 1.1% |
| Immigrants | Pakistan | 98.4 /100 | #75 | Exceptional 1.1% |
| Immigrants | Burma/Myanmar | 98.2 /100 | #76 | Exceptional 1.1% |
| Immigrants | Denmark | 98.1 /100 | #77 | Exceptional 1.1% |
| West Indians | 98.0 /100 | #78 | Exceptional 1.1% |
| Hmong | 98.0 /100 | #79 | Exceptional 1.1% |
| Immigrants | Trinidad and Tobago | 98.0 /100 | #80 | Exceptional 1.1% |
| Turks | 98.0 /100 | #81 | Exceptional 1.1% |