Immigrants from Iraq vs Immigrants from Belize Disability Age Under 5
COMPARE
Immigrants from Iraq
Immigrants from Belize
Disability Age Under 5
Disability Age Under 5 Comparison
Immigrants from Iraq
Immigrants from Belize
1.1%
DISABILITY AGE UNDER 5
96.5/ 100
METRIC RATING
97th/ 347
METRIC RANK
1.1%
DISABILITY AGE UNDER 5
98.7/ 100
METRIC RATING
67th/ 347
METRIC RANK
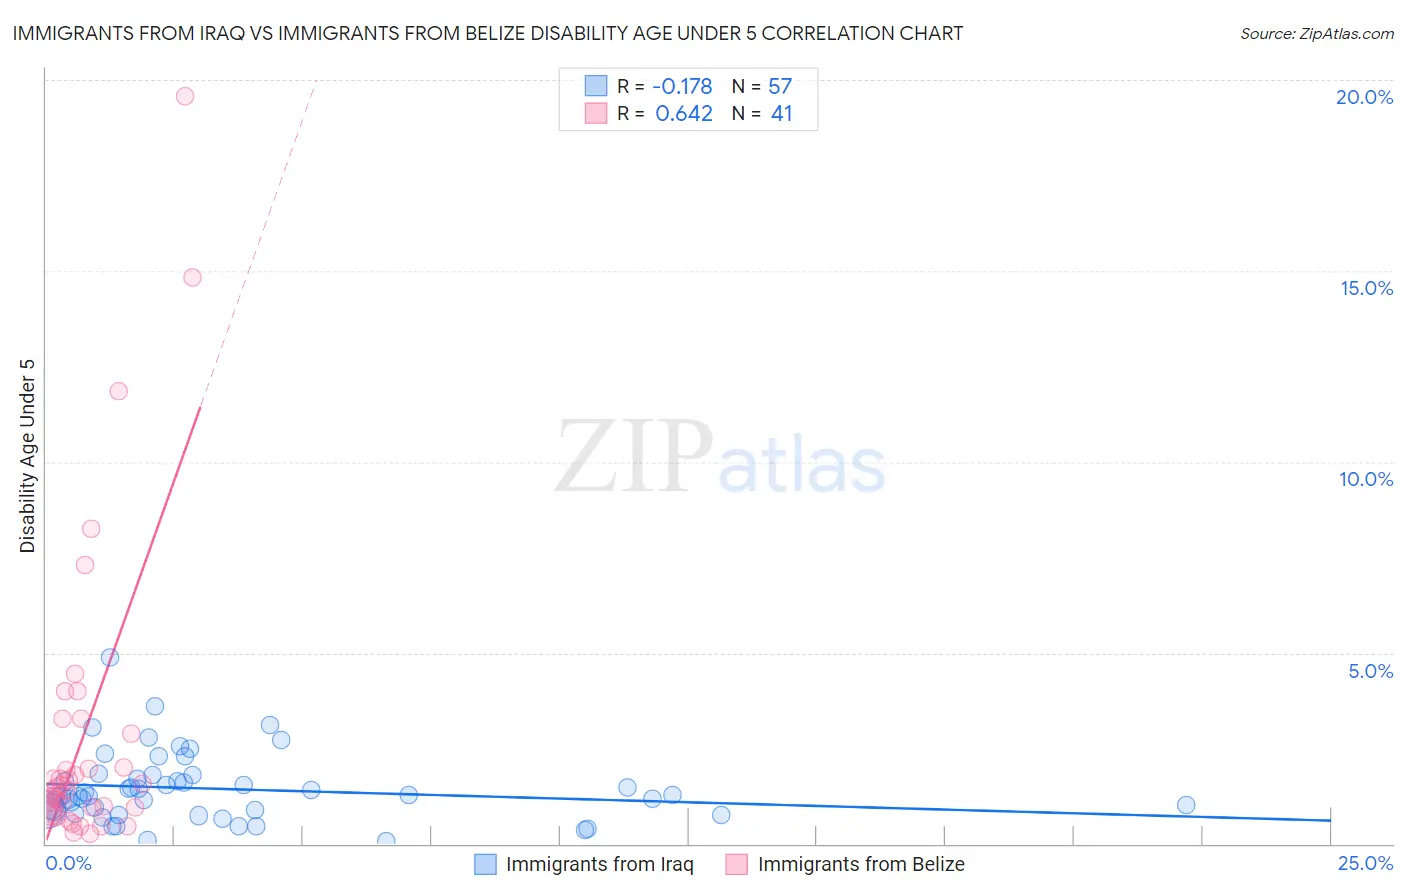
Immigrants from Iraq vs Immigrants from Belize Disability Age Under 5 Correlation Chart
The statistical analysis conducted on geographies consisting of 131,193,910 people shows a poor negative correlation between the proportion of Immigrants from Iraq and percentage of population with a disability under the age of 5 in the United States with a correlation coefficient (R) of -0.178 and weighted average of 1.1%. Similarly, the statistical analysis conducted on geographies consisting of 95,414,478 people shows a significant positive correlation between the proportion of Immigrants from Belize and percentage of population with a disability under the age of 5 in the United States with a correlation coefficient (R) of 0.642 and weighted average of 1.1%, a difference of 2.5%.
Disability Age Under 5 Correlation Summary
| Measurement | Immigrants from Iraq | Immigrants from Belize |
| Minimum | 0.070% | 0.27% |
| Maximum | 4.9% | 19.6% |
| Range | 4.8% | 19.3% |
| Mean | 1.4% | 2.9% |
| Median | 1.3% | 1.5% |
| Interquartile 25% (IQ1) | 0.84% | 0.89% |
| Interquartile 75% (IQ3) | 1.7% | 3.1% |
| Interquartile Range (IQR) | 0.91% | 2.2% |
| Standard Deviation (Sample) | 0.90% | 4.0% |
| Standard Deviation (Population) | 0.89% | 4.0% |
Similar Demographics by Disability Age Under 5
Demographics Similar to Immigrants from Iraq by Disability Age Under 5
In terms of disability age under 5, the demographic groups most similar to Immigrants from Iraq are Immigrants from South Eastern Asia (1.1%, a difference of 0.010%), Mongolian (1.1%, a difference of 0.10%), Dominican (1.1%, a difference of 0.14%), Nicaraguan (1.1%, a difference of 0.17%), and Immigrants from Moldova (1.1%, a difference of 0.20%).
| Demographics | Rating | Rank | Disability Age Under 5 |
| Chinese | 97.2 /100 | #90 | Exceptional 1.1% |
| Albanians | 97.2 /100 | #91 | Exceptional 1.1% |
| Immigrants | Cuba | 97.0 /100 | #92 | Exceptional 1.1% |
| Spanish Americans | 96.9 /100 | #93 | Exceptional 1.1% |
| Sri Lankans | 96.8 /100 | #94 | Exceptional 1.1% |
| Immigrants | Moldova | 96.8 /100 | #95 | Exceptional 1.1% |
| Mongolians | 96.6 /100 | #96 | Exceptional 1.1% |
| Immigrants | Iraq | 96.5 /100 | #97 | Exceptional 1.1% |
| Immigrants | South Eastern Asia | 96.5 /100 | #98 | Exceptional 1.1% |
| Dominicans | 96.3 /100 | #99 | Exceptional 1.1% |
| Nicaraguans | 96.3 /100 | #100 | Exceptional 1.1% |
| Immigrants | Uganda | 96.1 /100 | #101 | Exceptional 1.1% |
| Immigrants | Morocco | 96.0 /100 | #102 | Exceptional 1.2% |
| Immigrants | Nicaragua | 96.0 /100 | #103 | Exceptional 1.2% |
| Indonesians | 95.9 /100 | #104 | Exceptional 1.2% |
Demographics Similar to Immigrants from Belize by Disability Age Under 5
In terms of disability age under 5, the demographic groups most similar to Immigrants from Belize are South African (1.1%, a difference of 0.040%), Israeli (1.1%, a difference of 0.060%), Immigrants from Indonesia (1.1%, a difference of 0.070%), Immigrants from Ecuador (1.1%, a difference of 0.15%), and Immigrants from Korea (1.1%, a difference of 0.19%).
| Demographics | Rating | Rank | Disability Age Under 5 |
| Immigrants | Western Asia | 99.2 /100 | #60 | Exceptional 1.1% |
| Immigrants | Ethiopia | 99.2 /100 | #61 | Exceptional 1.1% |
| Immigrants | Switzerland | 99.2 /100 | #62 | Exceptional 1.1% |
| Immigrants | Vietnam | 99.1 /100 | #63 | Exceptional 1.1% |
| Egyptians | 98.9 /100 | #64 | Exceptional 1.1% |
| Immigrants | Korea | 98.8 /100 | #65 | Exceptional 1.1% |
| Immigrants | Indonesia | 98.7 /100 | #66 | Exceptional 1.1% |
| Immigrants | Belize | 98.7 /100 | #67 | Exceptional 1.1% |
| South Africans | 98.7 /100 | #68 | Exceptional 1.1% |
| Israelis | 98.7 /100 | #69 | Exceptional 1.1% |
| Immigrants | Ecuador | 98.6 /100 | #70 | Exceptional 1.1% |
| Trinidadians and Tobagonians | 98.6 /100 | #71 | Exceptional 1.1% |
| Burmese | 98.5 /100 | #72 | Exceptional 1.1% |
| Immigrants | Sri Lanka | 98.5 /100 | #73 | Exceptional 1.1% |
| Jordanians | 98.5 /100 | #74 | Exceptional 1.1% |