Comanche vs Thai Cognitive Disability
COMPARE
Comanche
Thai
Cognitive Disability
Cognitive Disability Comparison
Comanche
Thais
18.6%
COGNITIVE DISABILITY
0.0/ 100
METRIC RATING
319th/ 347
METRIC RANK
16.1%
COGNITIVE DISABILITY
100.0/ 100
METRIC RATING
6th/ 347
METRIC RANK
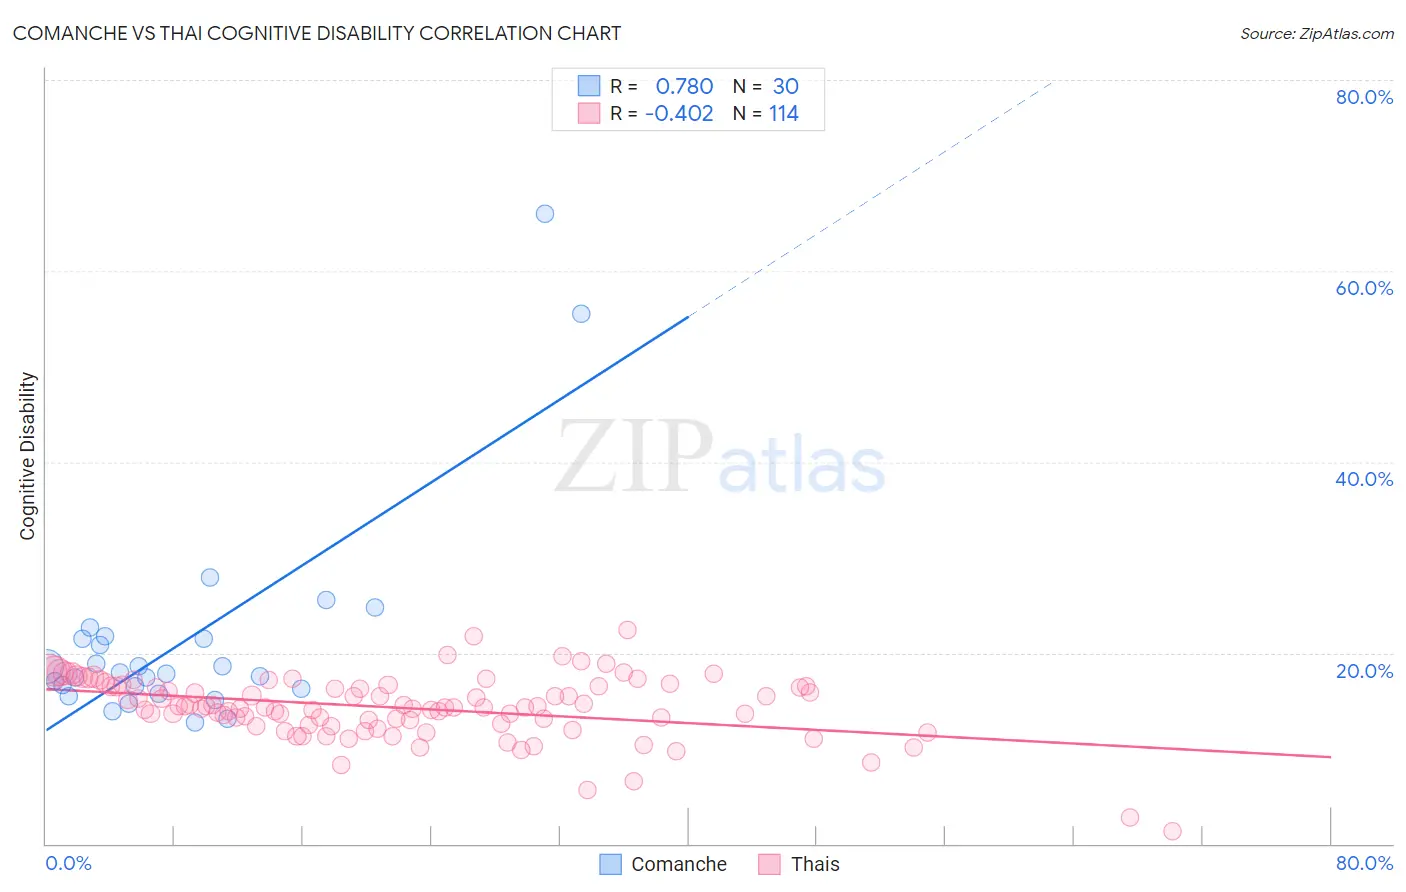
Comanche vs Thai Cognitive Disability Correlation Chart
The statistical analysis conducted on geographies consisting of 109,776,806 people shows a strong positive correlation between the proportion of Comanche and percentage of population with cognitive disability in the United States with a correlation coefficient (R) of 0.780 and weighted average of 18.6%. Similarly, the statistical analysis conducted on geographies consisting of 475,822,165 people shows a moderate negative correlation between the proportion of Thais and percentage of population with cognitive disability in the United States with a correlation coefficient (R) of -0.402 and weighted average of 16.1%, a difference of 15.5%.
Cognitive Disability Correlation Summary
| Measurement | Comanche | Thai |
| Minimum | 12.7% | 1.4% |
| Maximum | 66.0% | 22.4% |
| Range | 53.3% | 21.1% |
| Mean | 21.3% | 14.3% |
| Median | 17.9% | 14.3% |
| Interquartile 25% (IQ1) | 16.2% | 12.6% |
| Interquartile 75% (IQ3) | 21.5% | 16.5% |
| Interquartile Range (IQR) | 5.3% | 3.9% |
| Standard Deviation (Sample) | 11.4% | 3.3% |
| Standard Deviation (Population) | 11.2% | 3.3% |
Similar Demographics by Cognitive Disability
Demographics Similar to Comanche by Cognitive Disability
In terms of cognitive disability, the demographic groups most similar to Comanche are Bangladeshi (18.6%, a difference of 0.040%), Apache (18.6%, a difference of 0.040%), African (18.6%, a difference of 0.13%), Liberian (18.6%, a difference of 0.16%), and Immigrants from Liberia (18.7%, a difference of 0.19%).
| Demographics | Rating | Rank | Cognitive Disability |
| Chickasaw | 0.0 /100 | #312 | Tragic 18.5% |
| Yaqui | 0.0 /100 | #313 | Tragic 18.5% |
| Sub-Saharan Africans | 0.0 /100 | #314 | Tragic 18.5% |
| Immigrants | Dominica | 0.0 /100 | #315 | Tragic 18.6% |
| Immigrants | Middle Africa | 0.0 /100 | #316 | Tragic 18.6% |
| Liberians | 0.0 /100 | #317 | Tragic 18.6% |
| Bangladeshis | 0.0 /100 | #318 | Tragic 18.6% |
| Comanche | 0.0 /100 | #319 | Tragic 18.6% |
| Apache | 0.0 /100 | #320 | Tragic 18.6% |
| Africans | 0.0 /100 | #321 | Tragic 18.6% |
| Immigrants | Liberia | 0.0 /100 | #322 | Tragic 18.7% |
| Pueblo | 0.0 /100 | #323 | Tragic 18.7% |
| Dominicans | 0.0 /100 | #324 | Tragic 18.7% |
| Indonesians | 0.0 /100 | #325 | Tragic 18.7% |
| Immigrants | Senegal | 0.0 /100 | #326 | Tragic 18.7% |
Demographics Similar to Thais by Cognitive Disability
In terms of cognitive disability, the demographic groups most similar to Thais are Immigrants from Ireland (16.1%, a difference of 0.11%), Immigrants from Poland (16.1%, a difference of 0.13%), Assyrian/Chaldean/Syriac (16.2%, a difference of 0.45%), Immigrants from Scotland (16.2%, a difference of 0.50%), and Immigrants from Czechoslovakia (16.2%, a difference of 0.58%).
| Demographics | Rating | Rank | Cognitive Disability |
| Immigrants | Taiwan | 100.0 /100 | #1 | Exceptional 15.7% |
| Immigrants | India | 100.0 /100 | #2 | Exceptional 15.9% |
| Chinese | 100.0 /100 | #3 | Exceptional 15.9% |
| Immigrants | Lithuania | 100.0 /100 | #4 | Exceptional 16.0% |
| Immigrants | Hong Kong | 100.0 /100 | #5 | Exceptional 16.0% |
| Thais | 100.0 /100 | #6 | Exceptional 16.1% |
| Immigrants | Ireland | 100.0 /100 | #7 | Exceptional 16.1% |
| Immigrants | Poland | 100.0 /100 | #8 | Exceptional 16.1% |
| Assyrians/Chaldeans/Syriacs | 100.0 /100 | #9 | Exceptional 16.2% |
| Immigrants | Scotland | 100.0 /100 | #10 | Exceptional 16.2% |
| Immigrants | Czechoslovakia | 100.0 /100 | #11 | Exceptional 16.2% |
| Maltese | 100.0 /100 | #12 | Exceptional 16.2% |
| Lithuanians | 100.0 /100 | #13 | Exceptional 16.3% |
| Immigrants | Austria | 100.0 /100 | #14 | Exceptional 16.3% |
| Immigrants | Greece | 100.0 /100 | #15 | Exceptional 16.3% |