Immigrants from Iran vs Osage Disability Age 35 to 64
COMPARE
Immigrants from Iran
Osage
Disability Age 35 to 64
Disability Age 35 to 64 Comparison
Immigrants from Iran
Osage
8.5%
DISABILITY AGE 35 TO 64
100.0/ 100
METRIC RATING
5th/ 347
METRIC RANK
14.5%
DISABILITY AGE 35 TO 64
0.0/ 100
METRIC RATING
316th/ 347
METRIC RANK
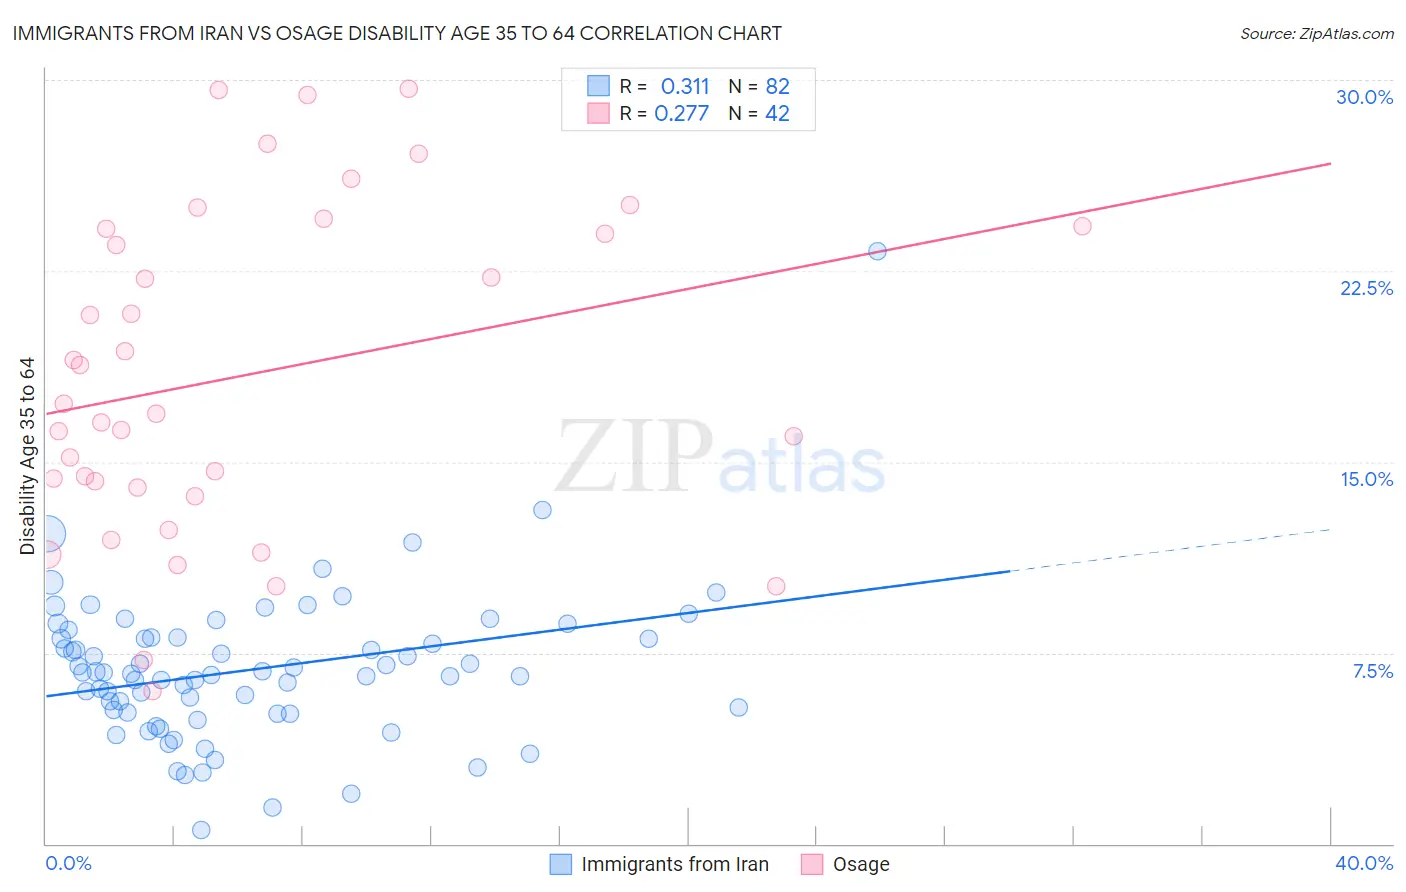
Immigrants from Iran vs Osage Disability Age 35 to 64 Correlation Chart
The statistical analysis conducted on geographies consisting of 279,816,013 people shows a mild positive correlation between the proportion of Immigrants from Iran and percentage of population with a disability between the ages 34 and 64 in the United States with a correlation coefficient (R) of 0.311 and weighted average of 8.5%. Similarly, the statistical analysis conducted on geographies consisting of 91,796,232 people shows a weak positive correlation between the proportion of Osage and percentage of population with a disability between the ages 34 and 64 in the United States with a correlation coefficient (R) of 0.277 and weighted average of 14.5%, a difference of 70.7%.
Disability Age 35 to 64 Correlation Summary
| Measurement | Immigrants from Iran | Osage |
| Minimum | 0.52% | 6.0% |
| Maximum | 23.3% | 29.7% |
| Range | 22.7% | 23.7% |
| Mean | 6.8% | 18.4% |
| Median | 6.7% | 17.1% |
| Interquartile 25% (IQ1) | 5.1% | 14.0% |
| Interquartile 75% (IQ3) | 8.1% | 24.2% |
| Interquartile Range (IQR) | 3.0% | 10.2% |
| Standard Deviation (Sample) | 3.0% | 6.4% |
| Standard Deviation (Population) | 3.0% | 6.3% |
Similar Demographics by Disability Age 35 to 64
Demographics Similar to Immigrants from Iran by Disability Age 35 to 64
In terms of disability age 35 to 64, the demographic groups most similar to Immigrants from Iran are Thai (8.6%, a difference of 1.0%), Immigrants from Israel (8.6%, a difference of 1.4%), Iranian (8.7%, a difference of 2.0%), Immigrants from China (8.7%, a difference of 2.5%), and Immigrants from India (8.3%, a difference of 2.5%).
| Demographics | Rating | Rank | Disability Age 35 to 64 |
| Immigrants | Taiwan | 100.0 /100 | #1 | Exceptional 7.8% |
| Filipinos | 100.0 /100 | #2 | Exceptional 8.0% |
| Immigrants | Hong Kong | 100.0 /100 | #3 | Exceptional 8.2% |
| Immigrants | India | 100.0 /100 | #4 | Exceptional 8.3% |
| Immigrants | Iran | 100.0 /100 | #5 | Exceptional 8.5% |
| Thais | 100.0 /100 | #6 | Exceptional 8.6% |
| Immigrants | Israel | 100.0 /100 | #7 | Exceptional 8.6% |
| Iranians | 100.0 /100 | #8 | Exceptional 8.7% |
| Immigrants | China | 100.0 /100 | #9 | Exceptional 8.7% |
| Immigrants | Bolivia | 100.0 /100 | #10 | Exceptional 8.7% |
| Immigrants | Eastern Asia | 100.0 /100 | #11 | Exceptional 8.8% |
| Indians (Asian) | 100.0 /100 | #12 | Exceptional 8.9% |
| Immigrants | South Central Asia | 100.0 /100 | #13 | Exceptional 8.9% |
| Immigrants | Singapore | 100.0 /100 | #14 | Exceptional 8.9% |
| Bolivians | 100.0 /100 | #15 | Exceptional 8.9% |
Demographics Similar to Osage by Disability Age 35 to 64
In terms of disability age 35 to 64, the demographic groups most similar to Osage are Alaska Native (14.5%, a difference of 0.19%), Shoshone (14.5%, a difference of 0.21%), Crow (14.6%, a difference of 0.87%), Ottawa (14.6%, a difference of 0.95%), and Iroquois (14.4%, a difference of 0.97%).
| Demographics | Rating | Rank | Disability Age 35 to 64 |
| Cree | 0.0 /100 | #309 | Tragic 14.1% |
| Cape Verdeans | 0.0 /100 | #310 | Tragic 14.1% |
| Immigrants | Azores | 0.0 /100 | #311 | Tragic 14.3% |
| Paiute | 0.0 /100 | #312 | Tragic 14.3% |
| Iroquois | 0.0 /100 | #313 | Tragic 14.4% |
| Shoshone | 0.0 /100 | #314 | Tragic 14.5% |
| Alaska Natives | 0.0 /100 | #315 | Tragic 14.5% |
| Osage | 0.0 /100 | #316 | Tragic 14.5% |
| Crow | 0.0 /100 | #317 | Tragic 14.6% |
| Ottawa | 0.0 /100 | #318 | Tragic 14.6% |
| Immigrants | Cabo Verde | 0.0 /100 | #319 | Tragic 14.7% |
| Blacks/African Americans | 0.0 /100 | #320 | Tragic 14.7% |
| Comanche | 0.0 /100 | #321 | Tragic 14.7% |
| Potawatomi | 0.0 /100 | #322 | Tragic 14.8% |
| Apache | 0.0 /100 | #323 | Tragic 14.9% |