Immigrants from North America vs Osage Disability Age 35 to 64
COMPARE
Immigrants from North America
Osage
Disability Age 35 to 64
Disability Age 35 to 64 Comparison
Immigrants from North America
Osage
11.0%
DISABILITY AGE 35 TO 64
74.9/ 100
METRIC RATING
158th/ 347
METRIC RANK
14.5%
DISABILITY AGE 35 TO 64
0.0/ 100
METRIC RATING
316th/ 347
METRIC RANK
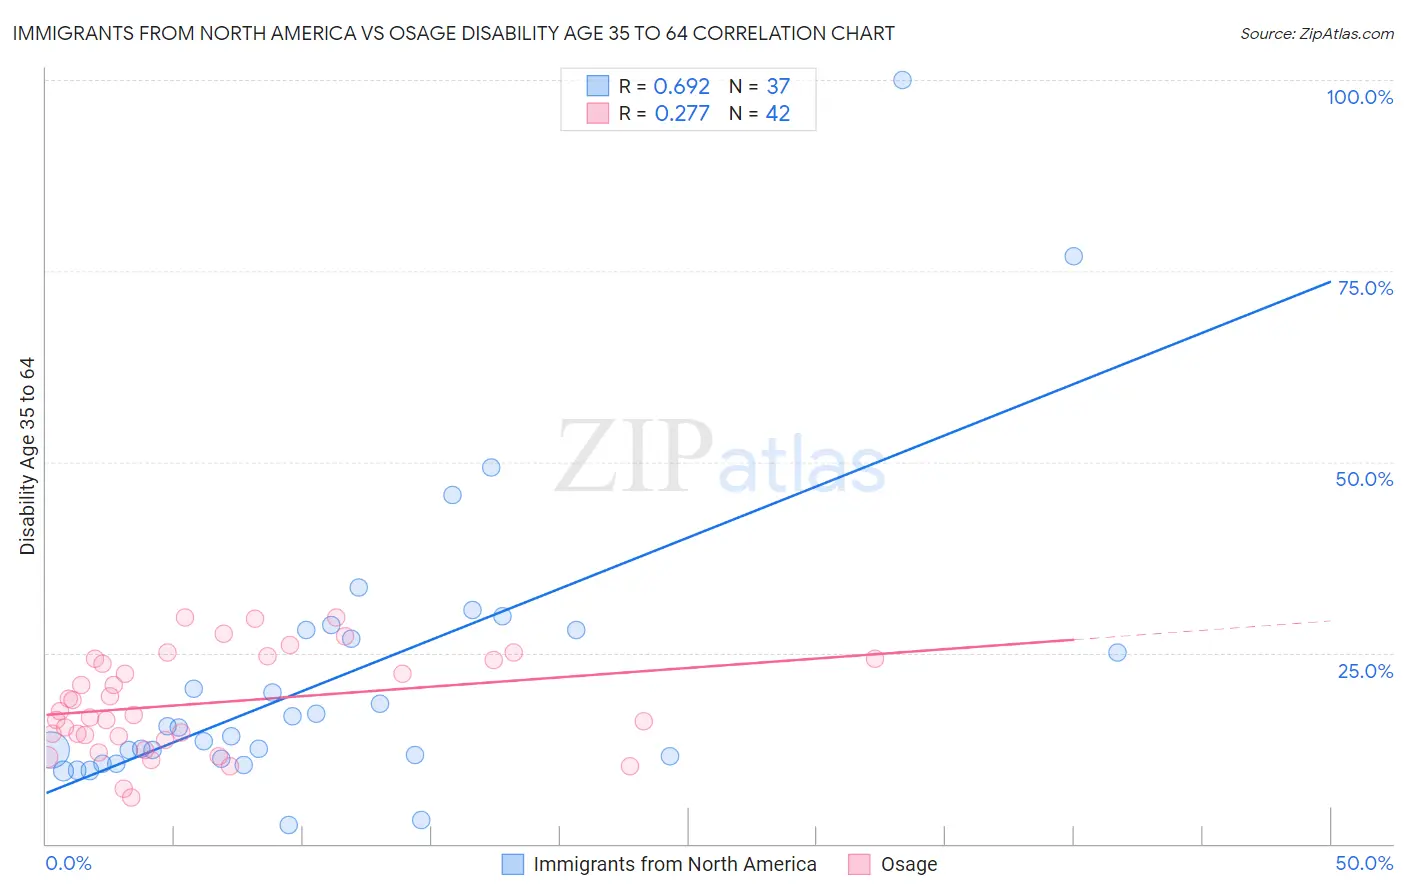
Immigrants from North America vs Osage Disability Age 35 to 64 Correlation Chart
The statistical analysis conducted on geographies consisting of 462,067,544 people shows a significant positive correlation between the proportion of Immigrants from North America and percentage of population with a disability between the ages 34 and 64 in the United States with a correlation coefficient (R) of 0.692 and weighted average of 11.0%. Similarly, the statistical analysis conducted on geographies consisting of 91,796,232 people shows a weak positive correlation between the proportion of Osage and percentage of population with a disability between the ages 34 and 64 in the United States with a correlation coefficient (R) of 0.277 and weighted average of 14.5%, a difference of 31.5%.
Disability Age 35 to 64 Correlation Summary
| Measurement | Immigrants from North America | Osage |
| Minimum | 2.4% | 6.0% |
| Maximum | 100.0% | 29.7% |
| Range | 97.6% | 23.7% |
| Mean | 22.0% | 18.4% |
| Median | 15.2% | 17.1% |
| Interquartile 25% (IQ1) | 11.3% | 14.0% |
| Interquartile 75% (IQ3) | 28.0% | 24.2% |
| Interquartile Range (IQR) | 16.7% | 10.2% |
| Standard Deviation (Sample) | 19.4% | 6.4% |
| Standard Deviation (Population) | 19.1% | 6.3% |
Similar Demographics by Disability Age 35 to 64
Demographics Similar to Immigrants from North America by Disability Age 35 to 64
In terms of disability age 35 to 64, the demographic groups most similar to Immigrants from North America are Guyanese (11.0%, a difference of 0.010%), Immigrants from Sierra Leone (11.0%, a difference of 0.14%), Serbian (11.0%, a difference of 0.14%), Moroccan (11.0%, a difference of 0.16%), and Immigrants from Canada (11.0%, a difference of 0.20%).
| Demographics | Rating | Rank | Disability Age 35 to 64 |
| New Zealanders | 79.3 /100 | #151 | Good 11.0% |
| Ukrainians | 78.0 /100 | #152 | Good 11.0% |
| Immigrants | England | 77.4 /100 | #153 | Good 11.0% |
| Immigrants | Canada | 76.7 /100 | #154 | Good 11.0% |
| Moroccans | 76.4 /100 | #155 | Good 11.0% |
| Immigrants | Sierra Leone | 76.2 /100 | #156 | Good 11.0% |
| Guyanese | 75.1 /100 | #157 | Good 11.0% |
| Immigrants | North America | 74.9 /100 | #158 | Good 11.0% |
| Serbians | 73.6 /100 | #159 | Good 11.0% |
| Croatians | 73.1 /100 | #160 | Good 11.0% |
| Immigrants | Guyana | 70.1 /100 | #161 | Good 11.1% |
| Immigrants | Grenada | 68.4 /100 | #162 | Good 11.1% |
| Immigrants | St. Vincent and the Grenadines | 66.6 /100 | #163 | Good 11.1% |
| Pakistanis | 65.8 /100 | #164 | Good 11.1% |
| Immigrants | Western Europe | 65.2 /100 | #165 | Good 11.1% |
Demographics Similar to Osage by Disability Age 35 to 64
In terms of disability age 35 to 64, the demographic groups most similar to Osage are Alaska Native (14.5%, a difference of 0.19%), Shoshone (14.5%, a difference of 0.21%), Crow (14.6%, a difference of 0.87%), Ottawa (14.6%, a difference of 0.95%), and Iroquois (14.4%, a difference of 0.97%).
| Demographics | Rating | Rank | Disability Age 35 to 64 |
| Cree | 0.0 /100 | #309 | Tragic 14.1% |
| Cape Verdeans | 0.0 /100 | #310 | Tragic 14.1% |
| Immigrants | Azores | 0.0 /100 | #311 | Tragic 14.3% |
| Paiute | 0.0 /100 | #312 | Tragic 14.3% |
| Iroquois | 0.0 /100 | #313 | Tragic 14.4% |
| Shoshone | 0.0 /100 | #314 | Tragic 14.5% |
| Alaska Natives | 0.0 /100 | #315 | Tragic 14.5% |
| Osage | 0.0 /100 | #316 | Tragic 14.5% |
| Crow | 0.0 /100 | #317 | Tragic 14.6% |
| Ottawa | 0.0 /100 | #318 | Tragic 14.6% |
| Immigrants | Cabo Verde | 0.0 /100 | #319 | Tragic 14.7% |
| Blacks/African Americans | 0.0 /100 | #320 | Tragic 14.7% |
| Comanche | 0.0 /100 | #321 | Tragic 14.7% |
| Potawatomi | 0.0 /100 | #322 | Tragic 14.8% |
| Apache | 0.0 /100 | #323 | Tragic 14.9% |