Immigrants from Iran vs British West Indian Disability Age 35 to 64
COMPARE
Immigrants from Iran
British West Indian
Disability Age 35 to 64
Disability Age 35 to 64 Comparison
Immigrants from Iran
British West Indians
8.5%
DISABILITY AGE 35 TO 64
100.0/ 100
METRIC RATING
5th/ 347
METRIC RANK
11.9%
DISABILITY AGE 35 TO 64
6.1/ 100
METRIC RATING
229th/ 347
METRIC RANK
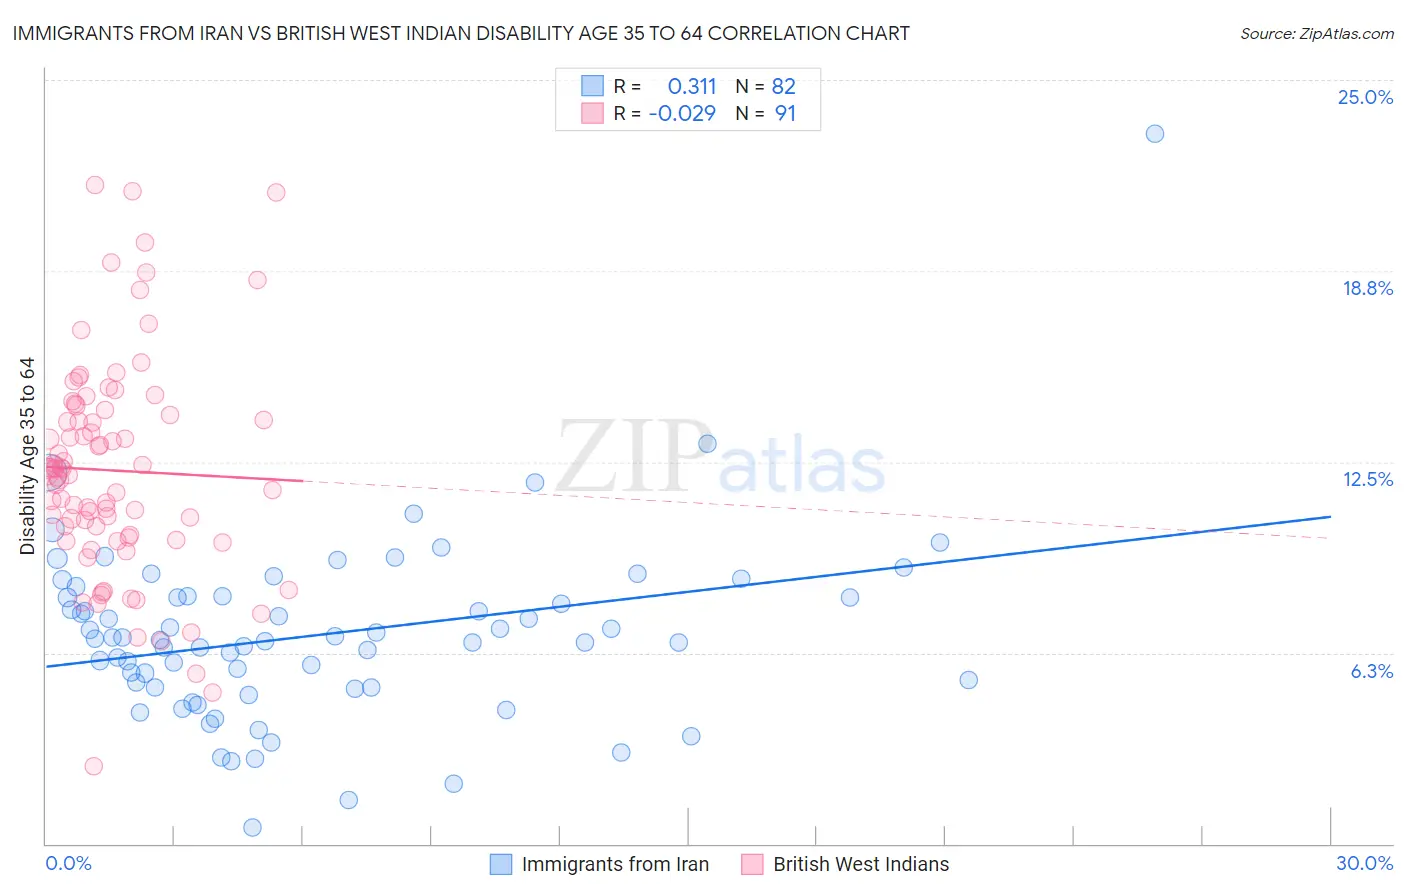
Immigrants from Iran vs British West Indian Disability Age 35 to 64 Correlation Chart
The statistical analysis conducted on geographies consisting of 279,816,013 people shows a mild positive correlation between the proportion of Immigrants from Iran and percentage of population with a disability between the ages 34 and 64 in the United States with a correlation coefficient (R) of 0.311 and weighted average of 8.5%. Similarly, the statistical analysis conducted on geographies consisting of 152,636,583 people shows no correlation between the proportion of British West Indians and percentage of population with a disability between the ages 34 and 64 in the United States with a correlation coefficient (R) of -0.029 and weighted average of 11.9%, a difference of 40.0%.
Disability Age 35 to 64 Correlation Summary
| Measurement | Immigrants from Iran | British West Indian |
| Minimum | 0.52% | 2.5% |
| Maximum | 23.3% | 21.5% |
| Range | 22.7% | 19.0% |
| Mean | 6.8% | 12.2% |
| Median | 6.7% | 12.1% |
| Interquartile 25% (IQ1) | 5.1% | 10.0% |
| Interquartile 75% (IQ3) | 8.1% | 14.2% |
| Interquartile Range (IQR) | 3.0% | 4.2% |
| Standard Deviation (Sample) | 3.0% | 3.6% |
| Standard Deviation (Population) | 3.0% | 3.6% |
Similar Demographics by Disability Age 35 to 64
Demographics Similar to Immigrants from Iran by Disability Age 35 to 64
In terms of disability age 35 to 64, the demographic groups most similar to Immigrants from Iran are Thai (8.6%, a difference of 1.0%), Immigrants from Israel (8.6%, a difference of 1.4%), Iranian (8.7%, a difference of 2.0%), Immigrants from China (8.7%, a difference of 2.5%), and Immigrants from India (8.3%, a difference of 2.5%).
| Demographics | Rating | Rank | Disability Age 35 to 64 |
| Immigrants | Taiwan | 100.0 /100 | #1 | Exceptional 7.8% |
| Filipinos | 100.0 /100 | #2 | Exceptional 8.0% |
| Immigrants | Hong Kong | 100.0 /100 | #3 | Exceptional 8.2% |
| Immigrants | India | 100.0 /100 | #4 | Exceptional 8.3% |
| Immigrants | Iran | 100.0 /100 | #5 | Exceptional 8.5% |
| Thais | 100.0 /100 | #6 | Exceptional 8.6% |
| Immigrants | Israel | 100.0 /100 | #7 | Exceptional 8.6% |
| Iranians | 100.0 /100 | #8 | Exceptional 8.7% |
| Immigrants | China | 100.0 /100 | #9 | Exceptional 8.7% |
| Immigrants | Bolivia | 100.0 /100 | #10 | Exceptional 8.7% |
| Immigrants | Eastern Asia | 100.0 /100 | #11 | Exceptional 8.8% |
| Indians (Asian) | 100.0 /100 | #12 | Exceptional 8.9% |
| Immigrants | South Central Asia | 100.0 /100 | #13 | Exceptional 8.9% |
| Immigrants | Singapore | 100.0 /100 | #14 | Exceptional 8.9% |
| Bolivians | 100.0 /100 | #15 | Exceptional 8.9% |
Demographics Similar to British West Indians by Disability Age 35 to 64
In terms of disability age 35 to 64, the demographic groups most similar to British West Indians are Immigrants from Germany (11.9%, a difference of 0.020%), Immigrants from Central America (11.9%, a difference of 0.060%), Scandinavian (11.9%, a difference of 0.090%), Panamanian (11.9%, a difference of 0.10%), and Jamaican (11.9%, a difference of 0.13%).
| Demographics | Rating | Rank | Disability Age 35 to 64 |
| Hondurans | 8.4 /100 | #222 | Tragic 11.8% |
| Immigrants | Honduras | 8.4 /100 | #223 | Tragic 11.8% |
| Immigrants | Ghana | 7.8 /100 | #224 | Tragic 11.8% |
| Immigrants | Belize | 6.6 /100 | #225 | Tragic 11.9% |
| Scandinavians | 6.4 /100 | #226 | Tragic 11.9% |
| Immigrants | Central America | 6.3 /100 | #227 | Tragic 11.9% |
| Immigrants | Germany | 6.2 /100 | #228 | Tragic 11.9% |
| British West Indians | 6.1 /100 | #229 | Tragic 11.9% |
| Panamanians | 5.8 /100 | #230 | Tragic 11.9% |
| Jamaicans | 5.7 /100 | #231 | Tragic 11.9% |
| Sudanese | 5.3 /100 | #232 | Tragic 11.9% |
| Bermudans | 5.0 /100 | #233 | Tragic 11.9% |
| Portuguese | 4.9 /100 | #234 | Tragic 11.9% |
| Belizeans | 4.5 /100 | #235 | Tragic 12.0% |
| Immigrants | Middle Africa | 4.5 /100 | #236 | Tragic 12.0% |