Immigrants from Iran vs Osage Seniors Poverty Over the Age of 75
COMPARE
Immigrants from Iran
Osage
Seniors Poverty Over the Age of 75
Seniors Poverty Over the Age of 75 Comparison
Immigrants from Iran
Osage
12.2%
SENIORS POVERTY OVER THE AGE OF 75
48.1/ 100
METRIC RATING
176th/ 347
METRIC RANK
11.4%
SENIORS POVERTY OVER THE AGE OF 75
96.3/ 100
METRIC RATING
71st/ 347
METRIC RANK
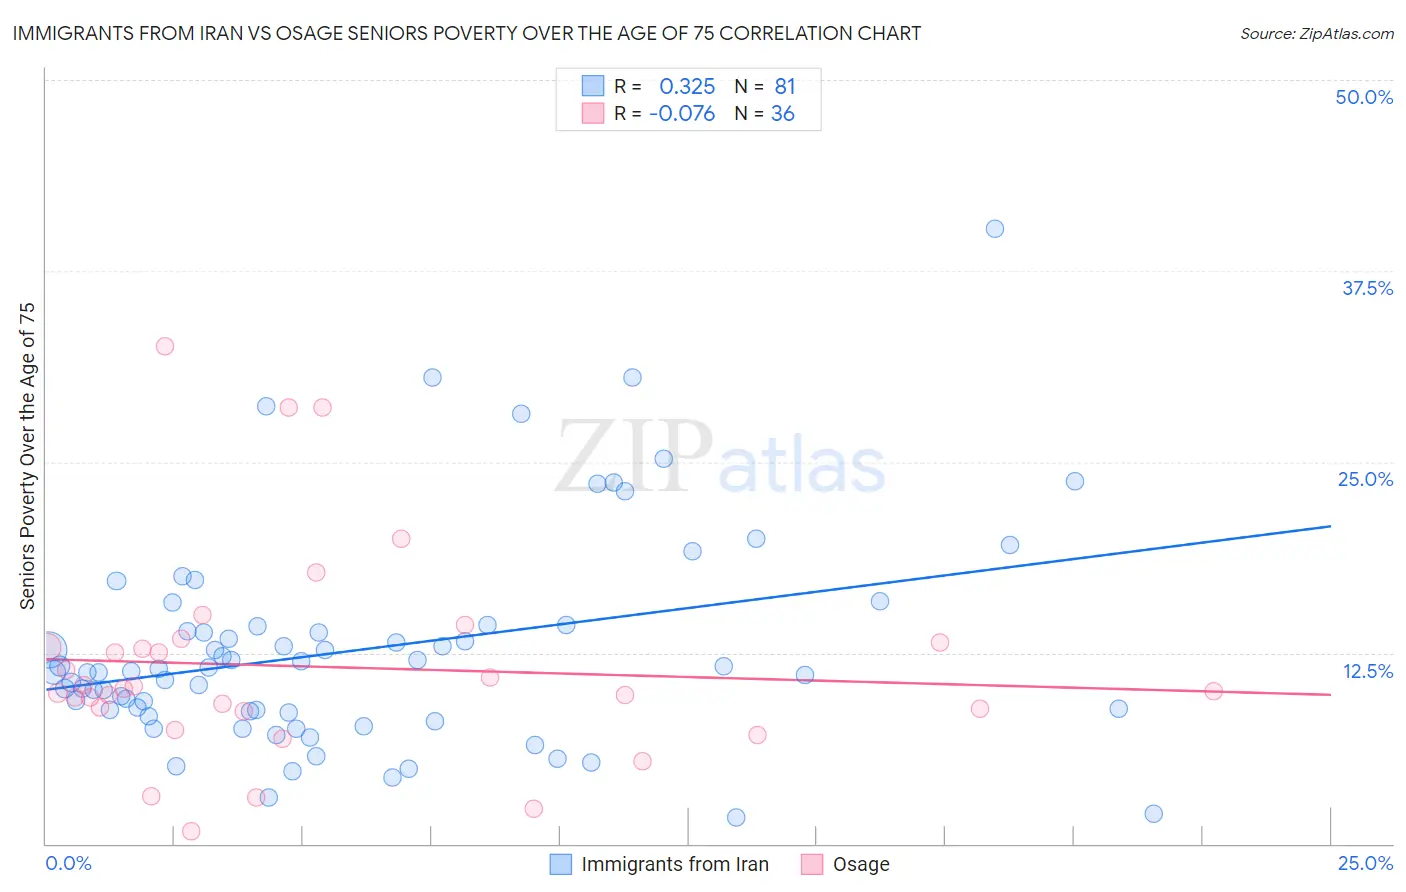
Immigrants from Iran vs Osage Seniors Poverty Over the Age of 75 Correlation Chart
The statistical analysis conducted on geographies consisting of 277,768,915 people shows a mild positive correlation between the proportion of Immigrants from Iran and poverty level among seniors over the age of 75 in the United States with a correlation coefficient (R) of 0.325 and weighted average of 12.2%. Similarly, the statistical analysis conducted on geographies consisting of 91,517,033 people shows a slight negative correlation between the proportion of Osage and poverty level among seniors over the age of 75 in the United States with a correlation coefficient (R) of -0.076 and weighted average of 11.4%, a difference of 7.2%.
Seniors Poverty Over the Age of 75 Correlation Summary
| Measurement | Immigrants from Iran | Osage |
| Minimum | 1.7% | 0.78% |
| Maximum | 40.3% | 32.6% |
| Range | 38.6% | 31.8% |
| Mean | 12.7% | 11.6% |
| Median | 11.3% | 10.1% |
| Interquartile 25% (IQ1) | 8.6% | 8.8% |
| Interquartile 75% (IQ3) | 14.3% | 13.0% |
| Interquartile Range (IQR) | 5.7% | 4.2% |
| Standard Deviation (Sample) | 7.0% | 6.9% |
| Standard Deviation (Population) | 7.0% | 6.8% |
Similar Demographics by Seniors Poverty Over the Age of 75
Demographics Similar to Immigrants from Iran by Seniors Poverty Over the Age of 75
In terms of seniors poverty over the age of 75, the demographic groups most similar to Immigrants from Iran are Immigrants from Asia (12.2%, a difference of 0.020%), Nonimmigrants (12.2%, a difference of 0.10%), Immigrants from Saudi Arabia (12.2%, a difference of 0.11%), Immigrants from Europe (12.2%, a difference of 0.16%), and Arab (12.2%, a difference of 0.19%).
| Demographics | Rating | Rank | Seniors Poverty Over the Age of 75 |
| Immigrants | Egypt | 53.7 /100 | #169 | Average 12.2% |
| Immigrants | Thailand | 52.0 /100 | #170 | Average 12.2% |
| Spaniards | 51.6 /100 | #171 | Average 12.2% |
| Immigrants | Fiji | 51.5 /100 | #172 | Average 12.2% |
| Arabs | 50.5 /100 | #173 | Average 12.2% |
| Immigrants | Europe | 50.0 /100 | #174 | Average 12.2% |
| Immigrants | Saudi Arabia | 49.5 /100 | #175 | Average 12.2% |
| Immigrants | Iran | 48.1 /100 | #176 | Average 12.2% |
| Immigrants | Asia | 47.8 /100 | #177 | Average 12.2% |
| Immigrants | Nonimmigrants | 46.8 /100 | #178 | Average 12.2% |
| Mongolians | 45.5 /100 | #179 | Average 12.2% |
| Immigrants | South Eastern Asia | 44.3 /100 | #180 | Average 12.2% |
| Immigrants | Australia | 44.2 /100 | #181 | Average 12.2% |
| German Russians | 41.4 /100 | #182 | Average 12.3% |
| Laotians | 38.2 /100 | #183 | Fair 12.3% |
Demographics Similar to Osage by Seniors Poverty Over the Age of 75
In terms of seniors poverty over the age of 75, the demographic groups most similar to Osage are Immigrants from South Central Asia (11.4%, a difference of 0.080%), Sierra Leonean (11.4%, a difference of 0.10%), Ottawa (11.4%, a difference of 0.11%), Immigrants from Austria (11.4%, a difference of 0.12%), and Bolivian (11.4%, a difference of 0.15%).
| Demographics | Rating | Rank | Seniors Poverty Over the Age of 75 |
| Immigrants | Northern Europe | 97.4 /100 | #64 | Exceptional 11.3% |
| Immigrants | Taiwan | 96.7 /100 | #65 | Exceptional 11.4% |
| Estonians | 96.7 /100 | #66 | Exceptional 11.4% |
| Bolivians | 96.5 /100 | #67 | Exceptional 11.4% |
| Immigrants | Austria | 96.5 /100 | #68 | Exceptional 11.4% |
| Ottawa | 96.5 /100 | #69 | Exceptional 11.4% |
| Immigrants | South Central Asia | 96.4 /100 | #70 | Exceptional 11.4% |
| Osage | 96.3 /100 | #71 | Exceptional 11.4% |
| Sierra Leoneans | 96.1 /100 | #72 | Exceptional 11.4% |
| Immigrants | Micronesia | 96.0 /100 | #73 | Exceptional 11.4% |
| Delaware | 96.0 /100 | #74 | Exceptional 11.4% |
| Palestinians | 95.8 /100 | #75 | Exceptional 11.4% |
| French Canadians | 95.7 /100 | #76 | Exceptional 11.4% |
| Whites/Caucasians | 95.5 /100 | #77 | Exceptional 11.4% |
| Macedonians | 95.5 /100 | #78 | Exceptional 11.4% |