Immigrants from Romania vs Immigrants from Korea Disability Age 35 to 64
COMPARE
Immigrants from Romania
Immigrants from Korea
Disability Age 35 to 64
Disability Age 35 to 64 Comparison
Immigrants from Romania
Immigrants from Korea
10.0%
DISABILITY AGE 35 TO 64
99.7/ 100
METRIC RATING
64th/ 347
METRIC RANK
9.0%
DISABILITY AGE 35 TO 64
100.0/ 100
METRIC RATING
16th/ 347
METRIC RANK
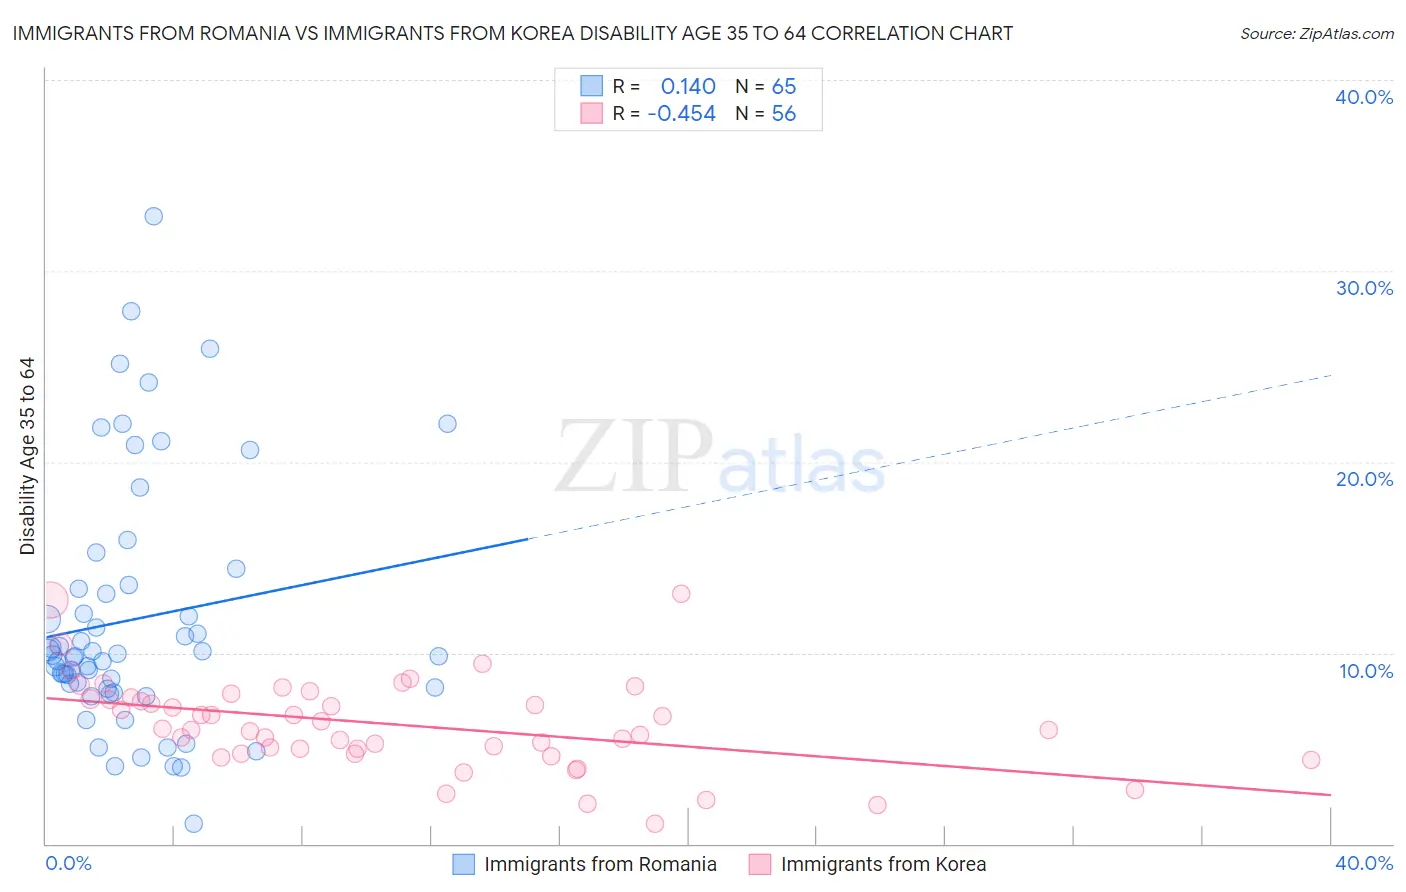
Immigrants from Romania vs Immigrants from Korea Disability Age 35 to 64 Correlation Chart
The statistical analysis conducted on geographies consisting of 256,941,595 people shows a poor positive correlation between the proportion of Immigrants from Romania and percentage of population with a disability between the ages 34 and 64 in the United States with a correlation coefficient (R) of 0.140 and weighted average of 10.0%. Similarly, the statistical analysis conducted on geographies consisting of 415,929,521 people shows a moderate negative correlation between the proportion of Immigrants from Korea and percentage of population with a disability between the ages 34 and 64 in the United States with a correlation coefficient (R) of -0.454 and weighted average of 9.0%, a difference of 11.4%.
Disability Age 35 to 64 Correlation Summary
| Measurement | Immigrants from Romania | Immigrants from Korea |
| Minimum | 1.0% | 1.0% |
| Maximum | 32.9% | 13.1% |
| Range | 31.8% | 12.0% |
| Mean | 11.8% | 6.3% |
| Median | 9.8% | 6.0% |
| Interquartile 25% (IQ1) | 8.1% | 4.9% |
| Interquartile 75% (IQ3) | 13.5% | 7.6% |
| Interquartile Range (IQR) | 5.3% | 2.8% |
| Standard Deviation (Sample) | 6.5% | 2.4% |
| Standard Deviation (Population) | 6.4% | 2.4% |
Similar Demographics by Disability Age 35 to 64
Demographics Similar to Immigrants from Romania by Disability Age 35 to 64
In terms of disability age 35 to 64, the demographic groups most similar to Immigrants from Romania are Immigrants from Poland (10.0%, a difference of 0.070%), Immigrants from Czechoslovakia (10.0%, a difference of 0.20%), Eastern European (10.0%, a difference of 0.31%), Cuban (10.0%, a difference of 0.32%), and Immigrants from Spain (10.0%, a difference of 0.41%).
| Demographics | Rating | Rank | Disability Age 35 to 64 |
| Colombians | 99.8 /100 | #57 | Exceptional 9.9% |
| Armenians | 99.8 /100 | #58 | Exceptional 9.9% |
| Immigrants | Sweden | 99.7 /100 | #59 | Exceptional 9.9% |
| Immigrants | South America | 99.7 /100 | #60 | Exceptional 9.9% |
| Immigrants | Spain | 99.7 /100 | #61 | Exceptional 10.0% |
| Eastern Europeans | 99.7 /100 | #62 | Exceptional 10.0% |
| Immigrants | Czechoslovakia | 99.7 /100 | #63 | Exceptional 10.0% |
| Immigrants | Romania | 99.7 /100 | #64 | Exceptional 10.0% |
| Immigrants | Poland | 99.6 /100 | #65 | Exceptional 10.0% |
| Cubans | 99.6 /100 | #66 | Exceptional 10.0% |
| Immigrants | Uzbekistan | 99.5 /100 | #67 | Exceptional 10.1% |
| Immigrants | Switzerland | 99.5 /100 | #68 | Exceptional 10.1% |
| Immigrants | Eastern Europe | 99.5 /100 | #69 | Exceptional 10.1% |
| Immigrants | Nicaragua | 99.5 /100 | #70 | Exceptional 10.1% |
| Immigrants | Kazakhstan | 99.5 /100 | #71 | Exceptional 10.1% |
Demographics Similar to Immigrants from Korea by Disability Age 35 to 64
In terms of disability age 35 to 64, the demographic groups most similar to Immigrants from Korea are Bolivian (8.9%, a difference of 0.34%), Immigrants from Singapore (8.9%, a difference of 0.63%), Immigrants from South Central Asia (8.9%, a difference of 1.2%), Indian (Asian) (8.9%, a difference of 1.3%), and Immigrants from Eastern Asia (8.8%, a difference of 2.1%).
| Demographics | Rating | Rank | Disability Age 35 to 64 |
| Immigrants | China | 100.0 /100 | #9 | Exceptional 8.7% |
| Immigrants | Bolivia | 100.0 /100 | #10 | Exceptional 8.7% |
| Immigrants | Eastern Asia | 100.0 /100 | #11 | Exceptional 8.8% |
| Indians (Asian) | 100.0 /100 | #12 | Exceptional 8.9% |
| Immigrants | South Central Asia | 100.0 /100 | #13 | Exceptional 8.9% |
| Immigrants | Singapore | 100.0 /100 | #14 | Exceptional 8.9% |
| Bolivians | 100.0 /100 | #15 | Exceptional 8.9% |
| Immigrants | Korea | 100.0 /100 | #16 | Exceptional 9.0% |
| Burmese | 100.0 /100 | #17 | Exceptional 9.2% |
| Soviet Union | 100.0 /100 | #18 | Exceptional 9.2% |
| Immigrants | Venezuela | 100.0 /100 | #19 | Exceptional 9.3% |
| Immigrants | Argentina | 100.0 /100 | #20 | Exceptional 9.3% |
| Okinawans | 100.0 /100 | #21 | Exceptional 9.4% |
| Cypriots | 100.0 /100 | #22 | Exceptional 9.4% |
| Argentineans | 100.0 /100 | #23 | Exceptional 9.4% |