Immigrants from India vs African Disability Age 35 to 64
COMPARE
Immigrants from India
African
Disability Age 35 to 64
Disability Age 35 to 64 Comparison
Immigrants from India
Africans
8.3%
DISABILITY AGE 35 TO 64
100.0/ 100
METRIC RATING
4th/ 347
METRIC RANK
13.6%
DISABILITY AGE 35 TO 64
0.0/ 100
METRIC RATING
296th/ 347
METRIC RANK
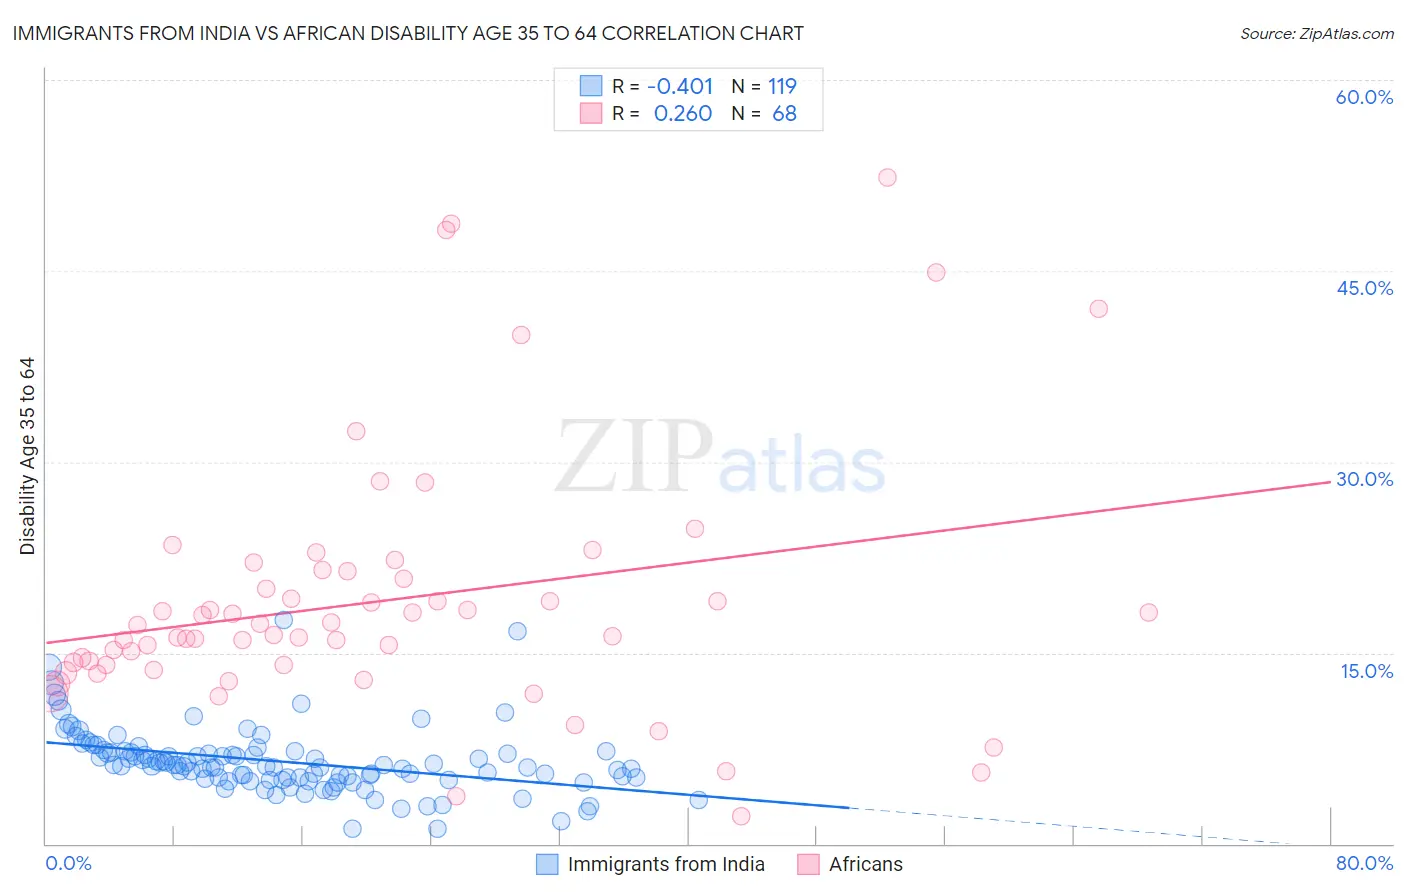
Immigrants from India vs African Disability Age 35 to 64 Correlation Chart
The statistical analysis conducted on geographies consisting of 433,679,908 people shows a moderate negative correlation between the proportion of Immigrants from India and percentage of population with a disability between the ages 34 and 64 in the United States with a correlation coefficient (R) of -0.401 and weighted average of 8.3%. Similarly, the statistical analysis conducted on geographies consisting of 469,523,166 people shows a weak positive correlation between the proportion of Africans and percentage of population with a disability between the ages 34 and 64 in the United States with a correlation coefficient (R) of 0.260 and weighted average of 13.6%, a difference of 63.9%.
Disability Age 35 to 64 Correlation Summary
| Measurement | Immigrants from India | African |
| Minimum | 1.1% | 2.2% |
| Maximum | 17.6% | 52.4% |
| Range | 16.5% | 50.2% |
| Mean | 6.5% | 19.1% |
| Median | 6.1% | 16.8% |
| Interquartile 25% (IQ1) | 5.1% | 14.0% |
| Interquartile 75% (IQ3) | 7.2% | 21.1% |
| Interquartile Range (IQR) | 2.1% | 7.1% |
| Standard Deviation (Sample) | 2.6% | 10.1% |
| Standard Deviation (Population) | 2.6% | 10.0% |
Similar Demographics by Disability Age 35 to 64
Demographics Similar to Immigrants from India by Disability Age 35 to 64
In terms of disability age 35 to 64, the demographic groups most similar to Immigrants from India are Immigrants from Hong Kong (8.2%, a difference of 1.1%), Immigrants from Iran (8.5%, a difference of 2.5%), Filipino (8.0%, a difference of 2.9%), Thai (8.6%, a difference of 3.5%), and Immigrants from Israel (8.6%, a difference of 4.0%).
| Demographics | Rating | Rank | Disability Age 35 to 64 |
| Immigrants | Taiwan | 100.0 /100 | #1 | Exceptional 7.8% |
| Filipinos | 100.0 /100 | #2 | Exceptional 8.0% |
| Immigrants | Hong Kong | 100.0 /100 | #3 | Exceptional 8.2% |
| Immigrants | India | 100.0 /100 | #4 | Exceptional 8.3% |
| Immigrants | Iran | 100.0 /100 | #5 | Exceptional 8.5% |
| Thais | 100.0 /100 | #6 | Exceptional 8.6% |
| Immigrants | Israel | 100.0 /100 | #7 | Exceptional 8.6% |
| Iranians | 100.0 /100 | #8 | Exceptional 8.7% |
| Immigrants | China | 100.0 /100 | #9 | Exceptional 8.7% |
| Immigrants | Bolivia | 100.0 /100 | #10 | Exceptional 8.7% |
| Immigrants | Eastern Asia | 100.0 /100 | #11 | Exceptional 8.8% |
| Indians (Asian) | 100.0 /100 | #12 | Exceptional 8.9% |
| Immigrants | South Central Asia | 100.0 /100 | #13 | Exceptional 8.9% |
| Immigrants | Singapore | 100.0 /100 | #14 | Exceptional 8.9% |
| Bolivians | 100.0 /100 | #15 | Exceptional 8.9% |
Demographics Similar to Africans by Disability Age 35 to 64
In terms of disability age 35 to 64, the demographic groups most similar to Africans are Yakama (13.6%, a difference of 0.22%), Bangladeshi (13.6%, a difference of 0.35%), Cheyenne (13.6%, a difference of 0.38%), Spanish American (13.7%, a difference of 0.58%), and Delaware (13.7%, a difference of 0.66%).
| Demographics | Rating | Rank | Disability Age 35 to 64 |
| Indonesians | 0.0 /100 | #289 | Tragic 13.2% |
| Immigrants | Liberia | 0.0 /100 | #290 | Tragic 13.2% |
| Immigrants | Congo | 0.0 /100 | #291 | Tragic 13.3% |
| Puget Sound Salish | 0.0 /100 | #292 | Tragic 13.3% |
| Ute | 0.0 /100 | #293 | Tragic 13.4% |
| Yaqui | 0.0 /100 | #294 | Tragic 13.5% |
| Yakama | 0.0 /100 | #295 | Tragic 13.6% |
| Africans | 0.0 /100 | #296 | Tragic 13.6% |
| Bangladeshis | 0.0 /100 | #297 | Tragic 13.6% |
| Cheyenne | 0.0 /100 | #298 | Tragic 13.6% |
| Spanish Americans | 0.0 /100 | #299 | Tragic 13.7% |
| Delaware | 0.0 /100 | #300 | Tragic 13.7% |
| French American Indians | 0.0 /100 | #301 | Tragic 13.7% |
| Aleuts | 0.0 /100 | #302 | Tragic 13.8% |
| Sioux | 0.0 /100 | #303 | Tragic 13.9% |