Immigrants from Hungary vs Czechoslovakian Female Disability
COMPARE
Immigrants from Hungary
Czechoslovakian
Female Disability
Female Disability Comparison
Immigrants from Hungary
Czechoslovakians
11.9%
FEMALE DISABILITY
92.8/ 100
METRIC RATING
139th/ 347
METRIC RANK
12.7%
FEMALE DISABILITY
0.9/ 100
METRIC RATING
262nd/ 347
METRIC RANK
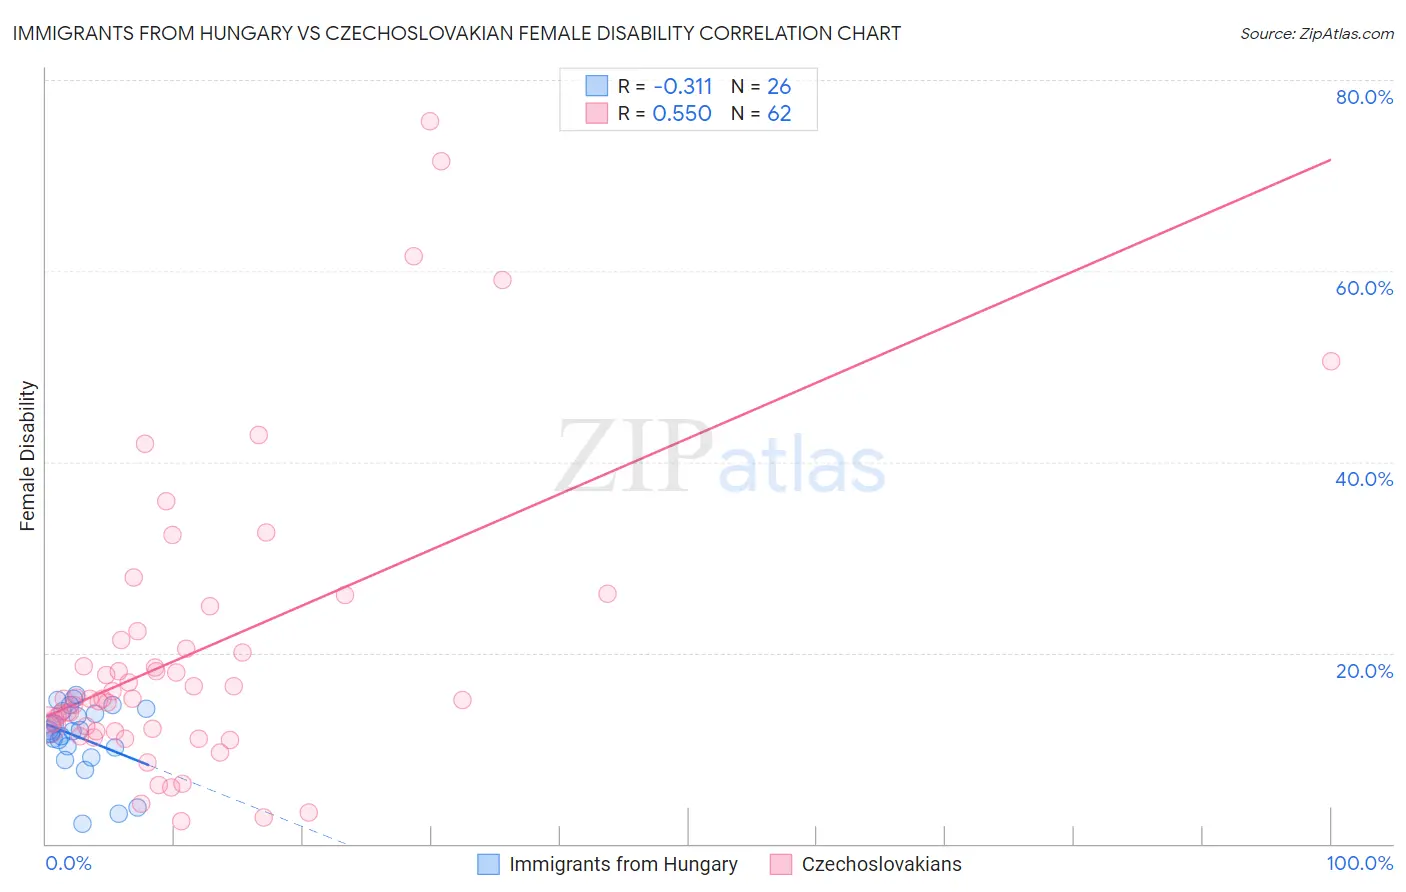
Immigrants from Hungary vs Czechoslovakian Female Disability Correlation Chart
The statistical analysis conducted on geographies consisting of 195,708,116 people shows a mild negative correlation between the proportion of Immigrants from Hungary and percentage of females with a disability in the United States with a correlation coefficient (R) of -0.311 and weighted average of 11.9%. Similarly, the statistical analysis conducted on geographies consisting of 368,648,423 people shows a substantial positive correlation between the proportion of Czechoslovakians and percentage of females with a disability in the United States with a correlation coefficient (R) of 0.550 and weighted average of 12.7%, a difference of 7.0%.
Female Disability Correlation Summary
| Measurement | Immigrants from Hungary | Czechoslovakian |
| Minimum | 2.0% | 2.3% |
| Maximum | 15.6% | 75.7% |
| Range | 13.6% | 73.3% |
| Mean | 11.1% | 20.1% |
| Median | 11.8% | 15.2% |
| Interquartile 25% (IQ1) | 10.1% | 11.8% |
| Interquartile 75% (IQ3) | 13.9% | 21.4% |
| Interquartile Range (IQR) | 3.8% | 9.5% |
| Standard Deviation (Sample) | 3.6% | 15.6% |
| Standard Deviation (Population) | 3.6% | 15.5% |
Similar Demographics by Female Disability
Demographics Similar to Immigrants from Hungary by Female Disability
In terms of female disability, the demographic groups most similar to Immigrants from Hungary are Ecuadorian (11.9%, a difference of 0.090%), Immigrants from Norway (11.9%, a difference of 0.15%), Romanian (11.9%, a difference of 0.16%), Immigrants from Ecuador (11.9%, a difference of 0.18%), and Ugandan (11.9%, a difference of 0.19%).
| Demographics | Rating | Rank | Female Disability |
| Immigrants | Syria | 94.6 /100 | #132 | Exceptional 11.9% |
| Kenyans | 94.5 /100 | #133 | Exceptional 11.9% |
| Immigrants | Nicaragua | 94.5 /100 | #134 | Exceptional 11.9% |
| Central Americans | 94.2 /100 | #135 | Exceptional 11.9% |
| Ugandans | 94.0 /100 | #136 | Exceptional 11.9% |
| Immigrants | Norway | 93.8 /100 | #137 | Exceptional 11.9% |
| Ecuadorians | 93.4 /100 | #138 | Exceptional 11.9% |
| Immigrants | Hungary | 92.8 /100 | #139 | Exceptional 11.9% |
| Romanians | 91.6 /100 | #140 | Exceptional 11.9% |
| Immigrants | Ecuador | 91.5 /100 | #141 | Exceptional 11.9% |
| Immigrants | Africa | 90.0 /100 | #142 | Excellent 11.9% |
| Immigrants | Sudan | 89.6 /100 | #143 | Excellent 11.9% |
| Immigrants | Austria | 87.9 /100 | #144 | Excellent 12.0% |
| Estonians | 87.8 /100 | #145 | Excellent 12.0% |
| Pakistanis | 84.6 /100 | #146 | Excellent 12.0% |
Demographics Similar to Czechoslovakians by Female Disability
In terms of female disability, the demographic groups most similar to Czechoslovakians are Bermudan (12.7%, a difference of 0.070%), Subsaharan African (12.7%, a difference of 0.11%), Immigrants from Armenia (12.7%, a difference of 0.12%), Liberian (12.7%, a difference of 0.20%), and Aleut (12.7%, a difference of 0.20%).
| Demographics | Rating | Rank | Female Disability |
| Immigrants | Germany | 1.3 /100 | #255 | Tragic 12.7% |
| British West Indians | 1.2 /100 | #256 | Tragic 12.7% |
| Liberians | 1.1 /100 | #257 | Tragic 12.7% |
| Aleuts | 1.1 /100 | #258 | Tragic 12.7% |
| Immigrants | Armenia | 1.0 /100 | #259 | Tragic 12.7% |
| Sub-Saharan Africans | 1.0 /100 | #260 | Tragic 12.7% |
| Bermudans | 1.0 /100 | #261 | Tragic 12.7% |
| Czechoslovakians | 0.9 /100 | #262 | Tragic 12.7% |
| Spaniards | 0.7 /100 | #263 | Tragic 12.8% |
| Alaska Natives | 0.6 /100 | #264 | Tragic 12.8% |
| West Indians | 0.5 /100 | #265 | Tragic 12.8% |
| Finns | 0.4 /100 | #266 | Tragic 12.8% |
| Senegalese | 0.4 /100 | #267 | Tragic 12.8% |
| Immigrants | Laos | 0.4 /100 | #268 | Tragic 12.8% |
| Indonesians | 0.4 /100 | #269 | Tragic 12.8% |