Choctaw vs Afghan Vision Disability
COMPARE
Choctaw
Afghan
Vision Disability
Vision Disability Comparison
Choctaw
Afghans
3.3%
VISION DISABILITY
0.0/ 100
METRIC RATING
342nd/ 347
METRIC RANK
2.0%
VISION DISABILITY
99.5/ 100
METRIC RATING
50th/ 347
METRIC RANK
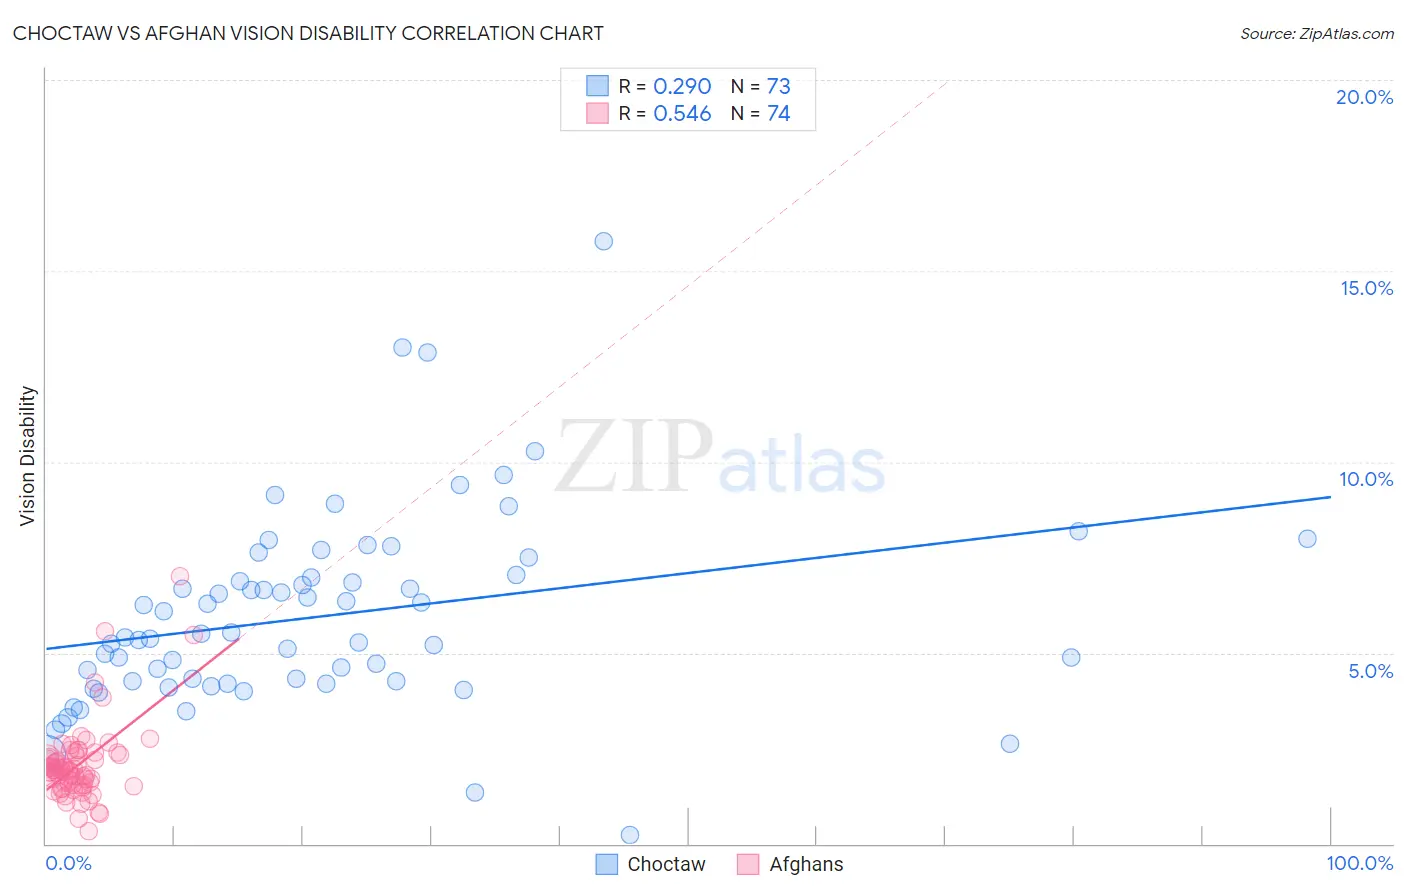
Choctaw vs Afghan Vision Disability Correlation Chart
The statistical analysis conducted on geographies consisting of 269,580,756 people shows a weak positive correlation between the proportion of Choctaw and percentage of population with vision disability in the United States with a correlation coefficient (R) of 0.290 and weighted average of 3.3%. Similarly, the statistical analysis conducted on geographies consisting of 148,842,568 people shows a substantial positive correlation between the proportion of Afghans and percentage of population with vision disability in the United States with a correlation coefficient (R) of 0.546 and weighted average of 2.0%, a difference of 66.1%.
Vision Disability Correlation Summary
| Measurement | Choctaw | Afghan |
| Minimum | 0.24% | 0.32% |
| Maximum | 15.8% | 7.0% |
| Range | 15.5% | 6.7% |
| Mean | 6.0% | 2.1% |
| Median | 5.4% | 1.9% |
| Interquartile 25% (IQ1) | 4.2% | 1.5% |
| Interquartile 75% (IQ3) | 7.0% | 2.3% |
| Interquartile Range (IQR) | 2.8% | 0.76% |
| Standard Deviation (Sample) | 2.6% | 1.0% |
| Standard Deviation (Population) | 2.6% | 1.0% |
Similar Demographics by Vision Disability
Demographics Similar to Choctaw by Vision Disability
In terms of vision disability, the demographic groups most similar to Choctaw are Pima (3.3%, a difference of 1.1%), Pueblo (3.3%, a difference of 1.1%), Kiowa (3.3%, a difference of 1.4%), Lumbee (3.4%, a difference of 2.7%), and Creek (3.2%, a difference of 2.8%).
| Demographics | Rating | Rank | Vision Disability |
| Cajuns | 0.0 /100 | #333 | Tragic 3.1% |
| Cheyenne | 0.0 /100 | #334 | Tragic 3.1% |
| Navajo | 0.0 /100 | #335 | Tragic 3.1% |
| Alaskan Athabascans | 0.0 /100 | #336 | Tragic 3.1% |
| Dutch West Indians | 0.0 /100 | #337 | Tragic 3.2% |
| Chickasaw | 0.0 /100 | #338 | Tragic 3.2% |
| Tsimshian | 0.0 /100 | #339 | Tragic 3.2% |
| Creek | 0.0 /100 | #340 | Tragic 3.2% |
| Kiowa | 0.0 /100 | #341 | Tragic 3.3% |
| Choctaw | 0.0 /100 | #342 | Tragic 3.3% |
| Pima | 0.0 /100 | #343 | Tragic 3.3% |
| Pueblo | 0.0 /100 | #344 | Tragic 3.3% |
| Lumbee | 0.0 /100 | #345 | Tragic 3.4% |
| Houma | 0.0 /100 | #346 | Tragic 3.4% |
| Puerto Ricans | 0.0 /100 | #347 | Tragic 3.9% |
Demographics Similar to Afghans by Vision Disability
In terms of vision disability, the demographic groups most similar to Afghans are Latvian (2.0%, a difference of 0.060%), Tongan (2.0%, a difference of 0.090%), Israeli (2.0%, a difference of 0.13%), Immigrants from Serbia (2.0%, a difference of 0.40%), and Immigrants from Belarus (2.0%, a difference of 0.51%).
| Demographics | Rating | Rank | Vision Disability |
| Eastern Europeans | 99.7 /100 | #43 | Exceptional 2.0% |
| Immigrants | Indonesia | 99.7 /100 | #44 | Exceptional 2.0% |
| Ethiopians | 99.7 /100 | #45 | Exceptional 2.0% |
| Immigrants | Sweden | 99.7 /100 | #46 | Exceptional 2.0% |
| Immigrants | Bulgaria | 99.7 /100 | #47 | Exceptional 2.0% |
| Israelis | 99.6 /100 | #48 | Exceptional 2.0% |
| Latvians | 99.5 /100 | #49 | Exceptional 2.0% |
| Afghans | 99.5 /100 | #50 | Exceptional 2.0% |
| Tongans | 99.5 /100 | #51 | Exceptional 2.0% |
| Immigrants | Serbia | 99.4 /100 | #52 | Exceptional 2.0% |
| Immigrants | Belarus | 99.3 /100 | #53 | Exceptional 2.0% |
| Macedonians | 99.3 /100 | #54 | Exceptional 2.0% |
| Laotians | 99.3 /100 | #55 | Exceptional 2.0% |
| Jordanians | 99.2 /100 | #56 | Exceptional 2.0% |
| Somalis | 99.2 /100 | #57 | Exceptional 2.0% |