Immigrants from Germany vs Zimbabwean Male Disability
COMPARE
Immigrants from Germany
Zimbabwean
Male Disability
Male Disability Comparison
Immigrants from Germany
Zimbabweans
12.3%
MALE DISABILITY
0.1/ 100
METRIC RATING
267th/ 347
METRIC RANK
10.6%
MALE DISABILITY
98.4/ 100
METRIC RATING
79th/ 347
METRIC RANK
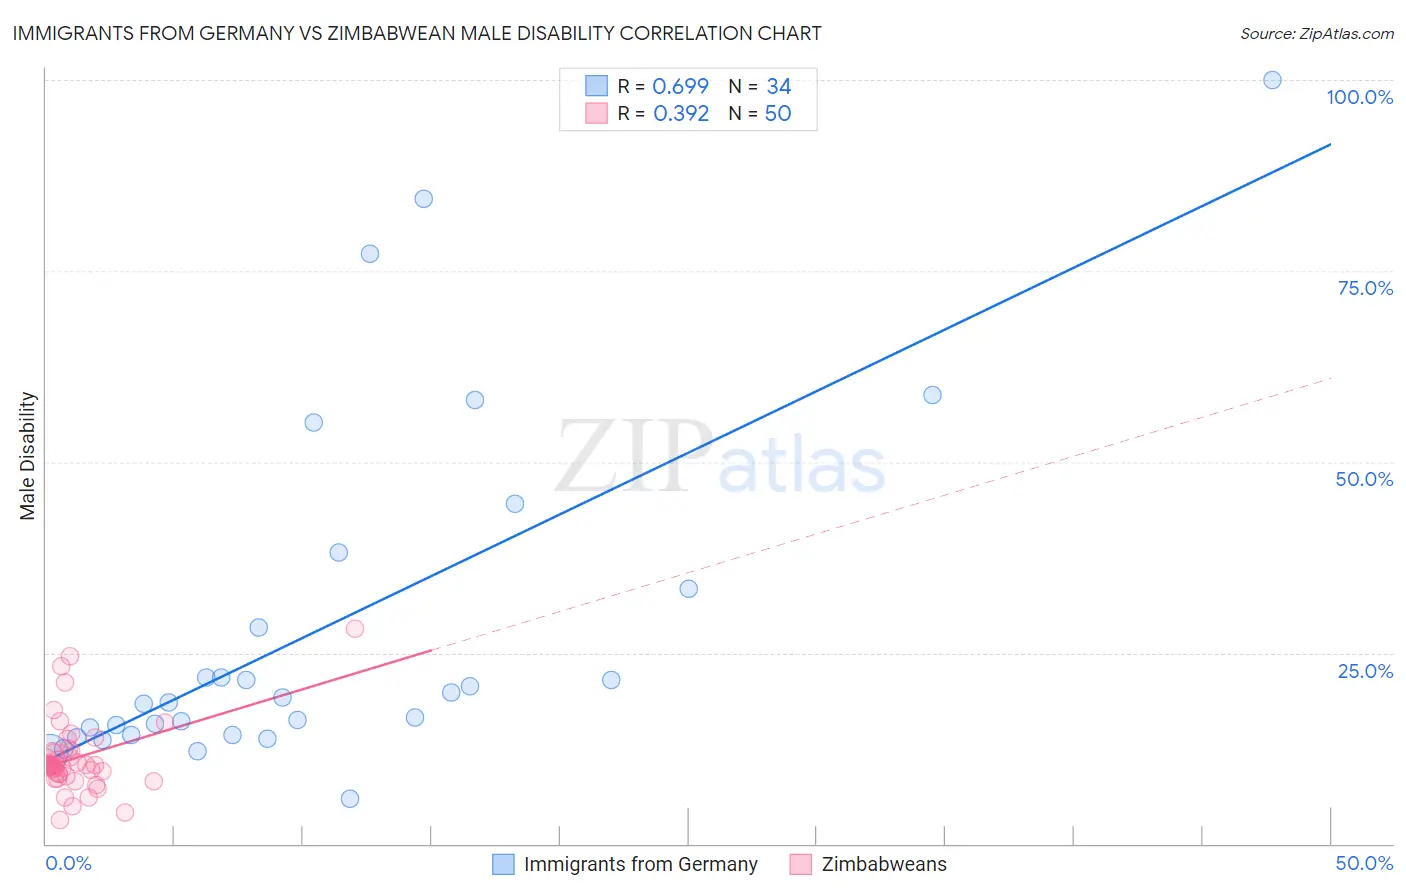
Immigrants from Germany vs Zimbabwean Male Disability Correlation Chart
The statistical analysis conducted on geographies consisting of 463,850,065 people shows a significant positive correlation between the proportion of Immigrants from Germany and percentage of males with a disability in the United States with a correlation coefficient (R) of 0.699 and weighted average of 12.3%. Similarly, the statistical analysis conducted on geographies consisting of 69,206,379 people shows a mild positive correlation between the proportion of Zimbabweans and percentage of males with a disability in the United States with a correlation coefficient (R) of 0.392 and weighted average of 10.6%, a difference of 16.0%.
Male Disability Correlation Summary
| Measurement | Immigrants from Germany | Zimbabwean |
| Minimum | 5.9% | 3.1% |
| Maximum | 100.0% | 28.1% |
| Range | 94.1% | 25.0% |
| Mean | 28.5% | 11.3% |
| Median | 18.8% | 10.2% |
| Interquartile 25% (IQ1) | 14.2% | 9.2% |
| Interquartile 75% (IQ3) | 33.3% | 12.1% |
| Interquartile Range (IQR) | 19.1% | 2.9% |
| Standard Deviation (Sample) | 23.0% | 4.8% |
| Standard Deviation (Population) | 22.7% | 4.8% |
Similar Demographics by Male Disability
Demographics Similar to Immigrants from Germany by Male Disability
In terms of male disability, the demographic groups most similar to Immigrants from Germany are Hawaiian (12.3%, a difference of 0.050%), Immigrants from Portugal (12.3%, a difference of 0.070%), Portuguese (12.3%, a difference of 0.13%), Czechoslovakian (12.3%, a difference of 0.13%), and Spaniard (12.3%, a difference of 0.21%).
| Demographics | Rating | Rank | Male Disability |
| Swedes | 0.3 /100 | #260 | Tragic 12.1% |
| Slavs | 0.2 /100 | #261 | Tragic 12.2% |
| Norwegians | 0.2 /100 | #262 | Tragic 12.2% |
| Canadians | 0.2 /100 | #263 | Tragic 12.2% |
| Nepalese | 0.2 /100 | #264 | Tragic 12.2% |
| Immigrants | Portugal | 0.1 /100 | #265 | Tragic 12.3% |
| Hawaiians | 0.1 /100 | #266 | Tragic 12.3% |
| Immigrants | Germany | 0.1 /100 | #267 | Tragic 12.3% |
| Portuguese | 0.1 /100 | #268 | Tragic 12.3% |
| Czechoslovakians | 0.1 /100 | #269 | Tragic 12.3% |
| Spaniards | 0.1 /100 | #270 | Tragic 12.3% |
| Scandinavians | 0.1 /100 | #271 | Tragic 12.3% |
| Hmong | 0.0 /100 | #272 | Tragic 12.5% |
| Native Hawaiians | 0.0 /100 | #273 | Tragic 12.5% |
| Hopi | 0.0 /100 | #274 | Tragic 12.5% |
Demographics Similar to Zimbabweans by Male Disability
In terms of male disability, the demographic groups most similar to Zimbabweans are Immigrants from Jordan (10.6%, a difference of 0.020%), Immigrants from Chile (10.6%, a difference of 0.080%), Immigrants from Guyana (10.6%, a difference of 0.15%), Immigrants from Poland (10.6%, a difference of 0.21%), and Bulgarian (10.6%, a difference of 0.22%).
| Demographics | Rating | Rank | Male Disability |
| Immigrants | Serbia | 99.0 /100 | #72 | Exceptional 10.5% |
| Immigrants | Lithuania | 98.9 /100 | #73 | Exceptional 10.5% |
| Immigrants | Lebanon | 98.8 /100 | #74 | Exceptional 10.5% |
| Sierra Leoneans | 98.7 /100 | #75 | Exceptional 10.5% |
| Immigrants | Sierra Leone | 98.7 /100 | #76 | Exceptional 10.5% |
| Laotians | 98.6 /100 | #77 | Exceptional 10.6% |
| Immigrants | Russia | 98.6 /100 | #78 | Exceptional 10.6% |
| Zimbabweans | 98.4 /100 | #79 | Exceptional 10.6% |
| Immigrants | Jordan | 98.4 /100 | #80 | Exceptional 10.6% |
| Immigrants | Chile | 98.3 /100 | #81 | Exceptional 10.6% |
| Immigrants | Guyana | 98.2 /100 | #82 | Exceptional 10.6% |
| Immigrants | Poland | 98.1 /100 | #83 | Exceptional 10.6% |
| Bulgarians | 98.1 /100 | #84 | Exceptional 10.6% |
| Sri Lankans | 97.9 /100 | #85 | Exceptional 10.6% |
| Immigrants | Ireland | 97.9 /100 | #86 | Exceptional 10.6% |