Immigrants from Albania vs Macedonian Hearing Disability
COMPARE
Immigrants from Albania
Macedonian
Hearing Disability
Hearing Disability Comparison
Immigrants from Albania
Macedonians
2.9%
HEARING DISABILITY
88.5/ 100
METRIC RATING
125th/ 347
METRIC RANK
3.1%
HEARING DISABILITY
27.0/ 100
METRIC RATING
193rd/ 347
METRIC RANK
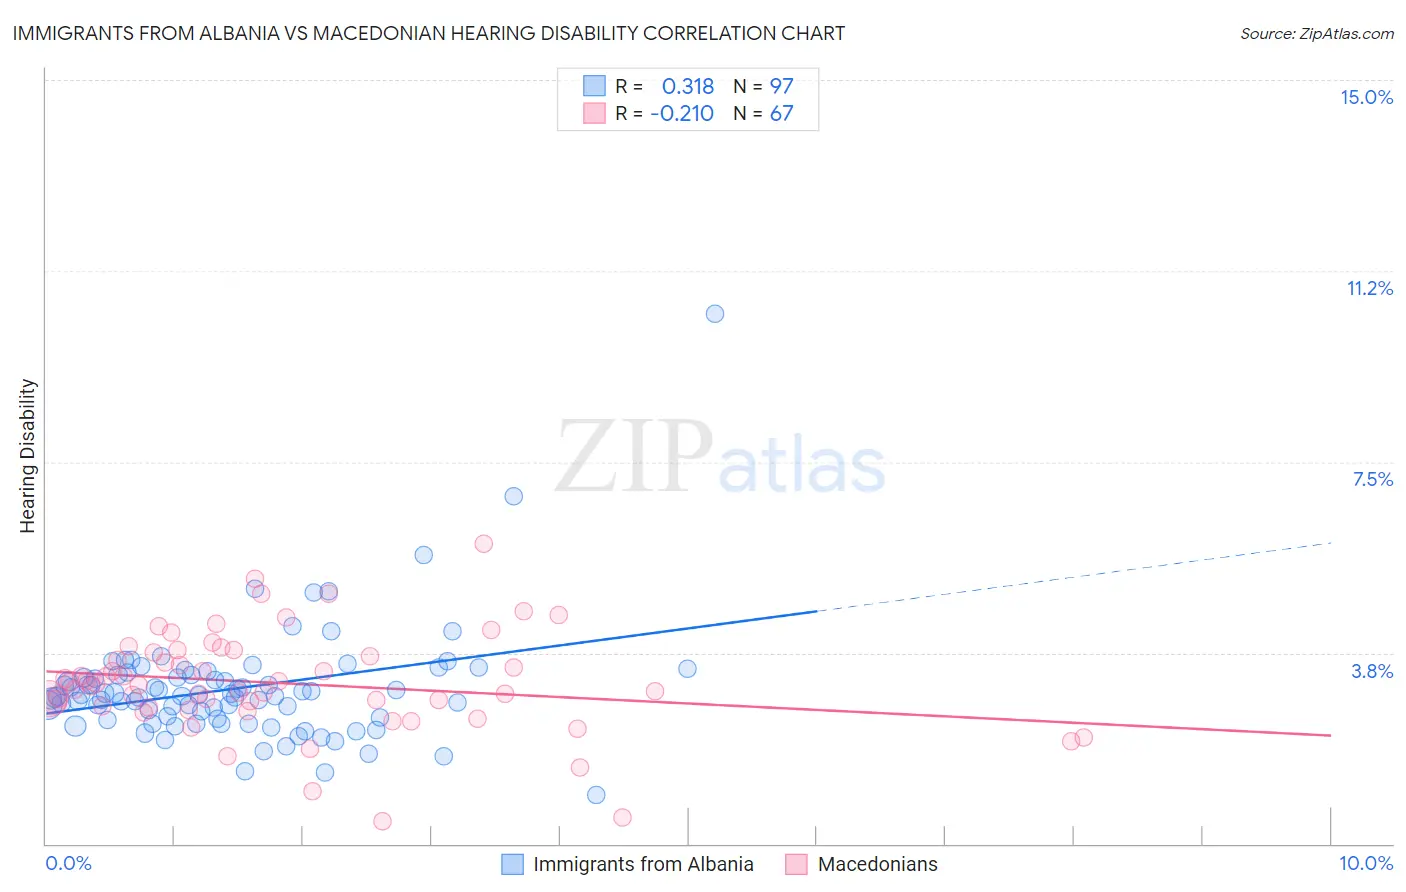
Immigrants from Albania vs Macedonian Hearing Disability Correlation Chart
The statistical analysis conducted on geographies consisting of 119,393,957 people shows a mild positive correlation between the proportion of Immigrants from Albania and percentage of population with hearing disability in the United States with a correlation coefficient (R) of 0.318 and weighted average of 2.9%. Similarly, the statistical analysis conducted on geographies consisting of 132,651,102 people shows a weak negative correlation between the proportion of Macedonians and percentage of population with hearing disability in the United States with a correlation coefficient (R) of -0.210 and weighted average of 3.1%, a difference of 7.5%.
Hearing Disability Correlation Summary
| Measurement | Immigrants from Albania | Macedonian |
| Minimum | 0.95% | 0.44% |
| Maximum | 10.4% | 5.9% |
| Range | 9.5% | 5.4% |
| Mean | 3.0% | 3.2% |
| Median | 2.9% | 3.1% |
| Interquartile 25% (IQ1) | 2.5% | 2.7% |
| Interquartile 75% (IQ3) | 3.3% | 3.8% |
| Interquartile Range (IQR) | 0.85% | 1.1% |
| Standard Deviation (Sample) | 1.1% | 0.99% |
| Standard Deviation (Population) | 1.1% | 0.99% |
Similar Demographics by Hearing Disability
Demographics Similar to Immigrants from Albania by Hearing Disability
In terms of hearing disability, the demographic groups most similar to Immigrants from Albania are Immigrants from Zaire (2.9%, a difference of 0.030%), Bahamian (2.9%, a difference of 0.030%), Liberian (2.8%, a difference of 0.13%), Immigrants from Sudan (2.9%, a difference of 0.16%), and Cuban (2.8%, a difference of 0.22%).
| Demographics | Rating | Rank | Hearing Disability |
| Zimbabweans | 89.9 /100 | #118 | Excellent 2.8% |
| Kenyans | 89.8 /100 | #119 | Excellent 2.8% |
| Jordanians | 89.5 /100 | #120 | Excellent 2.8% |
| Cubans | 89.4 /100 | #121 | Excellent 2.8% |
| Liberians | 89.0 /100 | #122 | Excellent 2.8% |
| Immigrants | Zaire | 88.6 /100 | #123 | Excellent 2.9% |
| Bahamians | 88.6 /100 | #124 | Excellent 2.9% |
| Immigrants | Albania | 88.5 /100 | #125 | Excellent 2.9% |
| Immigrants | Sudan | 87.8 /100 | #126 | Excellent 2.9% |
| South American Indians | 86.9 /100 | #127 | Excellent 2.9% |
| Immigrants | Western Asia | 86.9 /100 | #128 | Excellent 2.9% |
| Immigrants | Uganda | 86.6 /100 | #129 | Excellent 2.9% |
| Immigrants | Vietnam | 86.5 /100 | #130 | Excellent 2.9% |
| Immigrants | Kenya | 86.1 /100 | #131 | Excellent 2.9% |
| Chileans | 85.8 /100 | #132 | Excellent 2.9% |
Demographics Similar to Macedonians by Hearing Disability
In terms of hearing disability, the demographic groups most similar to Macedonians are Korean (3.1%, a difference of 0.080%), Immigrants from Switzerland (3.1%, a difference of 0.21%), South African (3.1%, a difference of 0.30%), Spanish American Indian (3.1%, a difference of 0.35%), and Immigrants from South Africa (3.1%, a difference of 0.46%).
| Demographics | Rating | Rank | Hearing Disability |
| Immigrants | Mexico | 34.9 /100 | #186 | Fair 3.0% |
| Blacks/African Americans | 34.7 /100 | #187 | Fair 3.0% |
| Mexican American Indians | 34.7 /100 | #188 | Fair 3.0% |
| Africans | 32.9 /100 | #189 | Fair 3.0% |
| Immigrants | South Africa | 31.1 /100 | #190 | Fair 3.1% |
| Immigrants | Switzerland | 28.8 /100 | #191 | Fair 3.1% |
| Koreans | 27.6 /100 | #192 | Fair 3.1% |
| Macedonians | 27.0 /100 | #193 | Fair 3.1% |
| South Africans | 24.5 /100 | #194 | Fair 3.1% |
| Spanish American Indians | 24.1 /100 | #195 | Fair 3.1% |
| Immigrants | Europe | 22.9 /100 | #196 | Fair 3.1% |
| Immigrants | Bosnia and Herzegovina | 20.6 /100 | #197 | Fair 3.1% |
| Immigrants | Croatia | 20.5 /100 | #198 | Fair 3.1% |
| Syrians | 19.2 /100 | #199 | Poor 3.1% |
| Immigrants | North Macedonia | 19.1 /100 | #200 | Poor 3.1% |