Immigrants from Europe vs Celtic Disability Age 5 to 17
COMPARE
Immigrants from Europe
Celtic
Disability Age 5 to 17
Disability Age 5 to 17 Comparison
Immigrants from Europe
Celtics
5.3%
DISABILITY AGE 5 TO 17
99.0/ 100
METRIC RATING
97th/ 347
METRIC RANK
6.3%
DISABILITY AGE 5 TO 17
0.0/ 100
METRIC RATING
302nd/ 347
METRIC RANK
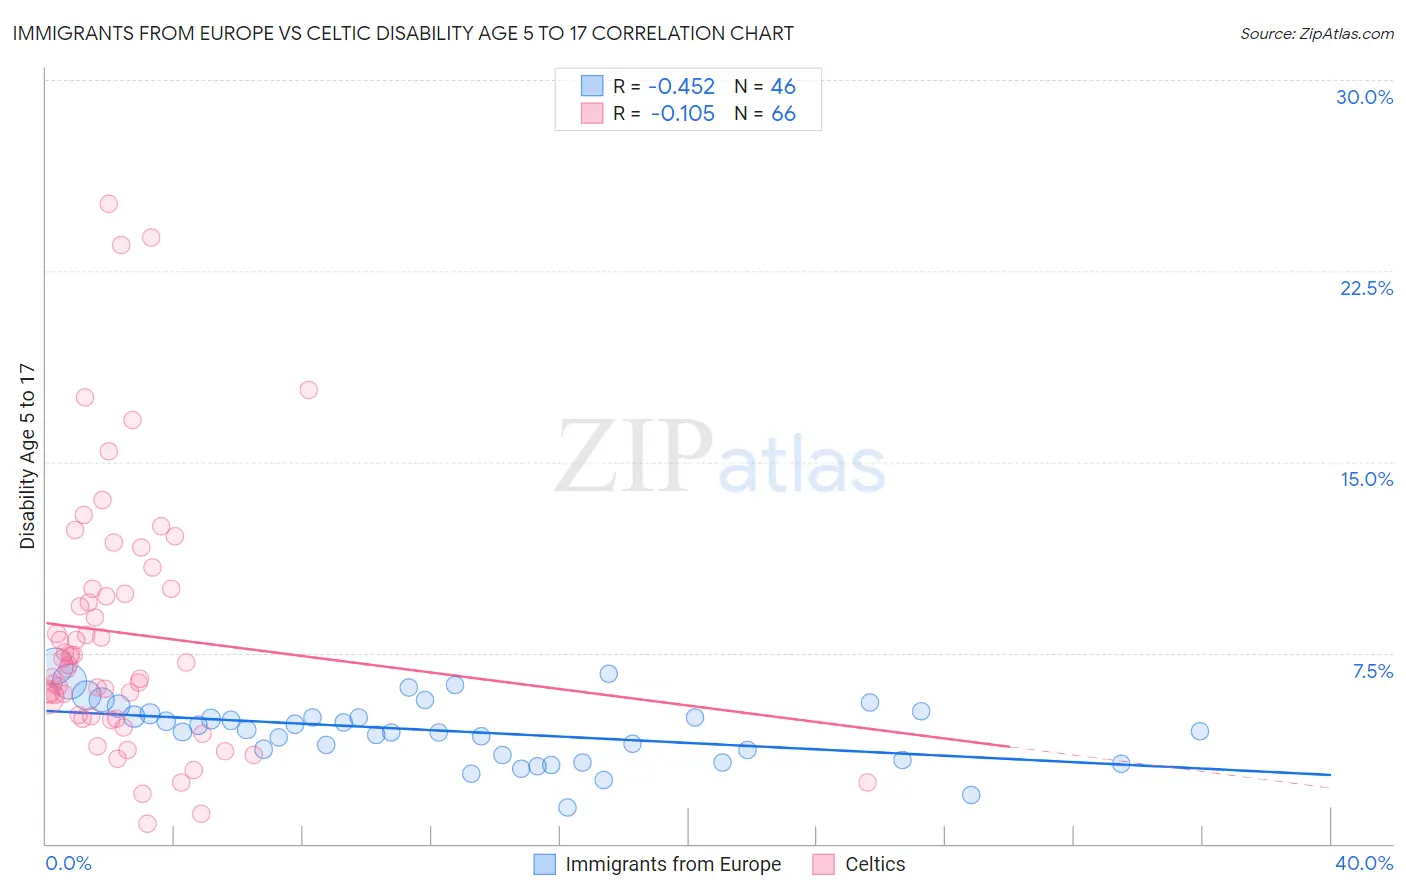
Immigrants from Europe vs Celtic Disability Age 5 to 17 Correlation Chart
The statistical analysis conducted on geographies consisting of 537,005,958 people shows a moderate negative correlation between the proportion of Immigrants from Europe and percentage of population with a disability between the ages 5 and 17 in the United States with a correlation coefficient (R) of -0.452 and weighted average of 5.3%. Similarly, the statistical analysis conducted on geographies consisting of 168,097,292 people shows a poor negative correlation between the proportion of Celtics and percentage of population with a disability between the ages 5 and 17 in the United States with a correlation coefficient (R) of -0.105 and weighted average of 6.3%, a difference of 18.9%.
Disability Age 5 to 17 Correlation Summary
| Measurement | Immigrants from Europe | Celtic |
| Minimum | 1.4% | 0.80% |
| Maximum | 6.9% | 25.1% |
| Range | 5.5% | 24.3% |
| Mean | 4.4% | 8.3% |
| Median | 4.5% | 7.1% |
| Interquartile 25% (IQ1) | 3.5% | 5.0% |
| Interquartile 75% (IQ3) | 5.1% | 10.0% |
| Interquartile Range (IQR) | 1.6% | 5.0% |
| Standard Deviation (Sample) | 1.2% | 5.1% |
| Standard Deviation (Population) | 1.2% | 5.1% |
Similar Demographics by Disability Age 5 to 17
Demographics Similar to Immigrants from Europe by Disability Age 5 to 17
In terms of disability age 5 to 17, the demographic groups most similar to Immigrants from Europe are Immigrants from El Salvador (5.3%, a difference of 0.0%), Immigrants from Austria (5.3%, a difference of 0.050%), Cambodian (5.3%, a difference of 0.15%), Immigrants from Grenada (5.3%, a difference of 0.16%), and Immigrants from Jordan (5.3%, a difference of 0.18%).
| Demographics | Rating | Rank | Disability Age 5 to 17 |
| Immigrants | Kuwait | 99.4 /100 | #90 | Exceptional 5.3% |
| Mongolians | 99.2 /100 | #91 | Exceptional 5.3% |
| Luxembourgers | 99.2 /100 | #92 | Exceptional 5.3% |
| Immigrants | Peru | 99.1 /100 | #93 | Exceptional 5.3% |
| Immigrants | Jordan | 99.1 /100 | #94 | Exceptional 5.3% |
| Immigrants | Grenada | 99.1 /100 | #95 | Exceptional 5.3% |
| Immigrants | El Salvador | 99.0 /100 | #96 | Exceptional 5.3% |
| Immigrants | Europe | 99.0 /100 | #97 | Exceptional 5.3% |
| Immigrants | Austria | 98.9 /100 | #98 | Exceptional 5.3% |
| Cambodians | 98.8 /100 | #99 | Exceptional 5.3% |
| Nepalese | 98.7 /100 | #100 | Exceptional 5.3% |
| Menominee | 98.7 /100 | #101 | Exceptional 5.3% |
| Nicaraguans | 98.6 /100 | #102 | Exceptional 5.3% |
| Salvadorans | 98.6 /100 | #103 | Exceptional 5.3% |
| Peruvians | 98.5 /100 | #104 | Exceptional 5.3% |
Demographics Similar to Celtics by Disability Age 5 to 17
In terms of disability age 5 to 17, the demographic groups most similar to Celtics are Yakama (6.3%, a difference of 0.10%), Senegalese (6.3%, a difference of 0.18%), U.S. Virgin Islander (6.3%, a difference of 0.33%), Native/Alaskan (6.3%, a difference of 0.33%), and Carpatho Rusyn (6.3%, a difference of 0.35%).
| Demographics | Rating | Rank | Disability Age 5 to 17 |
| Cree | 0.0 /100 | #295 | Tragic 6.2% |
| Spanish Americans | 0.0 /100 | #296 | Tragic 6.2% |
| Immigrants | Bahamas | 0.0 /100 | #297 | Tragic 6.2% |
| Lumbee | 0.0 /100 | #298 | Tragic 6.2% |
| Welsh | 0.0 /100 | #299 | Tragic 6.3% |
| Carpatho Rusyns | 0.0 /100 | #300 | Tragic 6.3% |
| U.S. Virgin Islanders | 0.0 /100 | #301 | Tragic 6.3% |
| Celtics | 0.0 /100 | #302 | Tragic 6.3% |
| Yakama | 0.0 /100 | #303 | Tragic 6.3% |
| Senegalese | 0.0 /100 | #304 | Tragic 6.3% |
| Natives/Alaskans | 0.0 /100 | #305 | Tragic 6.3% |
| Immigrants | Nonimmigrants | 0.0 /100 | #306 | Tragic 6.3% |
| Bahamians | 0.0 /100 | #307 | Tragic 6.3% |
| Scotch-Irish | 0.0 /100 | #308 | Tragic 6.3% |
| Hmong | 0.0 /100 | #309 | Tragic 6.3% |