Immigrants from Ethiopia vs New Zealander Unemployment Among Ages 35 to 44 years
COMPARE
Immigrants from Ethiopia
New Zealander
Unemployment Among Ages 35 to 44 years
Unemployment Among Ages 35 to 44 years Comparison
Immigrants from Ethiopia
New Zealanders
4.5%
UNEMPLOYMENT AMONG AGES 35 TO 44 YEARS
84.7/ 100
METRIC RATING
127th/ 347
METRIC RANK
4.5%
UNEMPLOYMENT AMONG AGES 35 TO 44 YEARS
90.3/ 100
METRIC RATING
108th/ 347
METRIC RANK
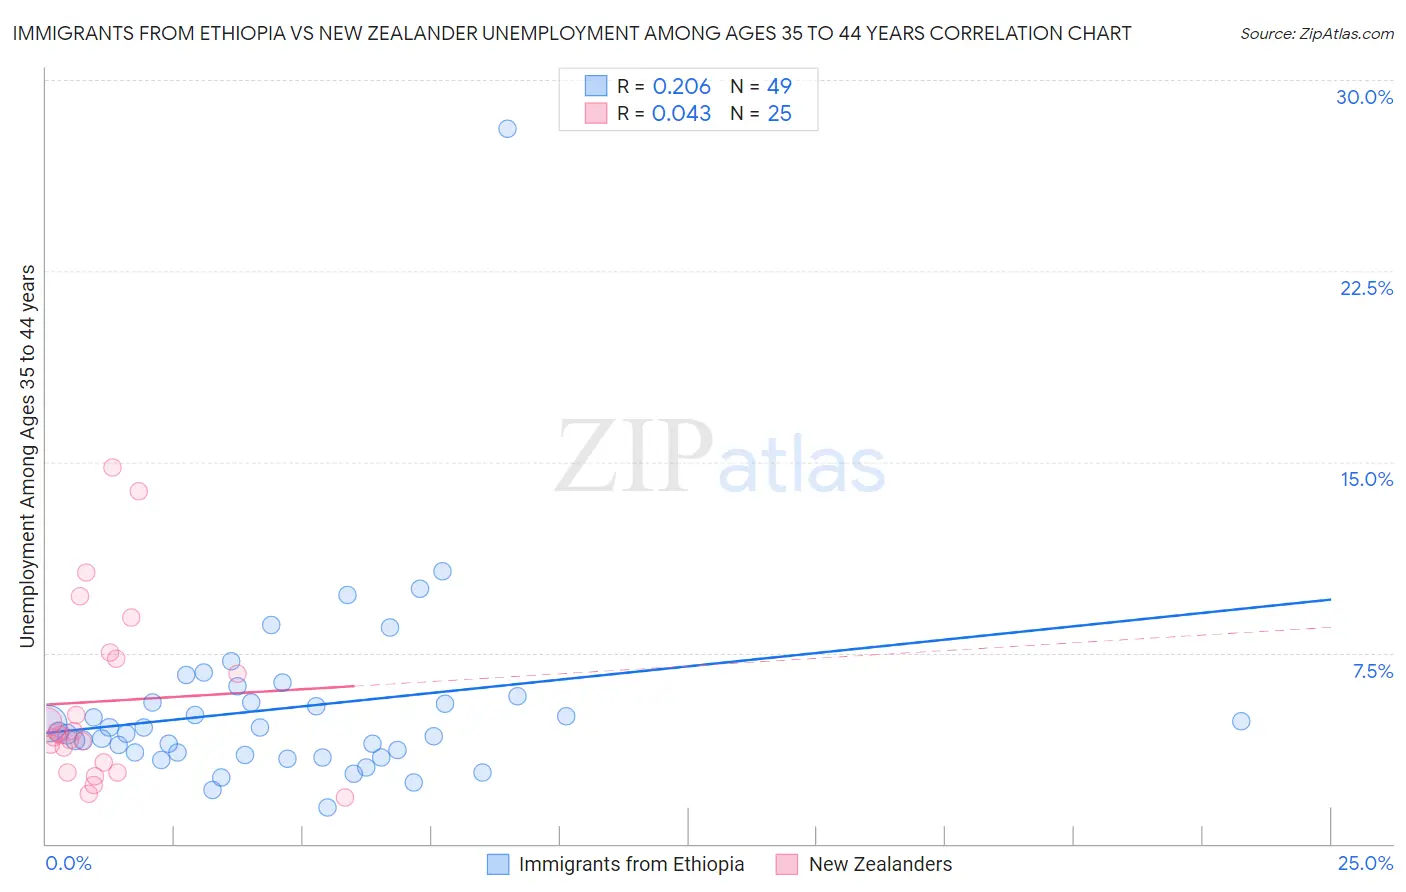
Immigrants from Ethiopia vs New Zealander Unemployment Among Ages 35 to 44 years Correlation Chart
The statistical analysis conducted on geographies consisting of 209,718,778 people shows a weak positive correlation between the proportion of Immigrants from Ethiopia and unemployment rate among population between the ages 35 and 44 in the United States with a correlation coefficient (R) of 0.206 and weighted average of 4.5%. Similarly, the statistical analysis conducted on geographies consisting of 106,194,191 people shows no correlation between the proportion of New Zealanders and unemployment rate among population between the ages 35 and 44 in the United States with a correlation coefficient (R) of 0.043 and weighted average of 4.5%, a difference of 0.97%.
Unemployment Among Ages 35 to 44 years Correlation Summary
| Measurement | Immigrants from Ethiopia | New Zealander |
| Minimum | 1.4% | 1.8% |
| Maximum | 28.1% | 14.8% |
| Range | 26.7% | 13.0% |
| Mean | 5.3% | 5.6% |
| Median | 4.4% | 4.3% |
| Interquartile 25% (IQ1) | 3.5% | 3.0% |
| Interquartile 75% (IQ3) | 5.7% | 7.4% |
| Interquartile Range (IQR) | 2.1% | 4.4% |
| Standard Deviation (Sample) | 3.9% | 3.5% |
| Standard Deviation (Population) | 3.8% | 3.5% |
Demographics Similar to Immigrants from Ethiopia and New Zealanders by Unemployment Among Ages 35 to 44 years
In terms of unemployment among ages 35 to 44 years, the demographic groups most similar to Immigrants from Ethiopia are Immigrants from Austria (4.5%, a difference of 0.010%), Immigrants from Northern Africa (4.5%, a difference of 0.20%), Immigrants from Spain (4.5%, a difference of 0.21%), Basque (4.5%, a difference of 0.24%), and Immigrants from South Africa (4.5%, a difference of 0.32%). Similarly, the demographic groups most similar to New Zealanders are Romanian (4.5%, a difference of 0.0%), Immigrants from Kazakhstan (4.5%, a difference of 0.070%), Immigrants from North Macedonia (4.5%, a difference of 0.090%), Immigrants from Nicaragua (4.5%, a difference of 0.10%), and Immigrants from Czechoslovakia (4.5%, a difference of 0.23%).
| Demographics | Rating | Rank | Unemployment Among Ages 35 to 44 years |
| Immigrants | North Macedonia | 90.7 /100 | #107 | Exceptional 4.5% |
| New Zealanders | 90.3 /100 | #108 | Exceptional 4.5% |
| Romanians | 90.3 /100 | #109 | Exceptional 4.5% |
| Immigrants | Kazakhstan | 90.0 /100 | #110 | Excellent 4.5% |
| Immigrants | Nicaragua | 89.8 /100 | #111 | Excellent 4.5% |
| Immigrants | Czechoslovakia | 89.2 /100 | #112 | Excellent 4.5% |
| Immigrants | Italy | 88.4 /100 | #113 | Excellent 4.5% |
| Macedonians | 88.3 /100 | #114 | Excellent 4.5% |
| Maltese | 88.1 /100 | #115 | Excellent 4.5% |
| Immigrants | Israel | 88.1 /100 | #116 | Excellent 4.5% |
| Immigrants | Greece | 87.9 /100 | #117 | Excellent 4.5% |
| Irish | 87.9 /100 | #118 | Excellent 4.5% |
| Nicaraguans | 87.6 /100 | #119 | Excellent 4.5% |
| Ethiopians | 87.1 /100 | #120 | Excellent 4.5% |
| Immigrants | South Africa | 86.8 /100 | #121 | Excellent 4.5% |
| Sri Lankans | 86.8 /100 | #122 | Excellent 4.5% |
| Basques | 86.3 /100 | #123 | Excellent 4.5% |
| Immigrants | Spain | 86.1 /100 | #124 | Excellent 4.5% |
| Immigrants | Northern Africa | 86.1 /100 | #125 | Excellent 4.5% |
| Immigrants | Austria | 84.7 /100 | #126 | Excellent 4.5% |
| Immigrants | Ethiopia | 84.7 /100 | #127 | Excellent 4.5% |