Immigrants from England vs Scandinavian Ambulatory Disability
COMPARE
Immigrants from England
Scandinavian
Ambulatory Disability
Ambulatory Disability Comparison
Immigrants from England
Scandinavians
6.1%
AMBULATORY DISABILITY
45.4/ 100
METRIC RATING
177th/ 347
METRIC RANK
6.1%
AMBULATORY DISABILITY
44.5/ 100
METRIC RATING
178th/ 347
METRIC RANK
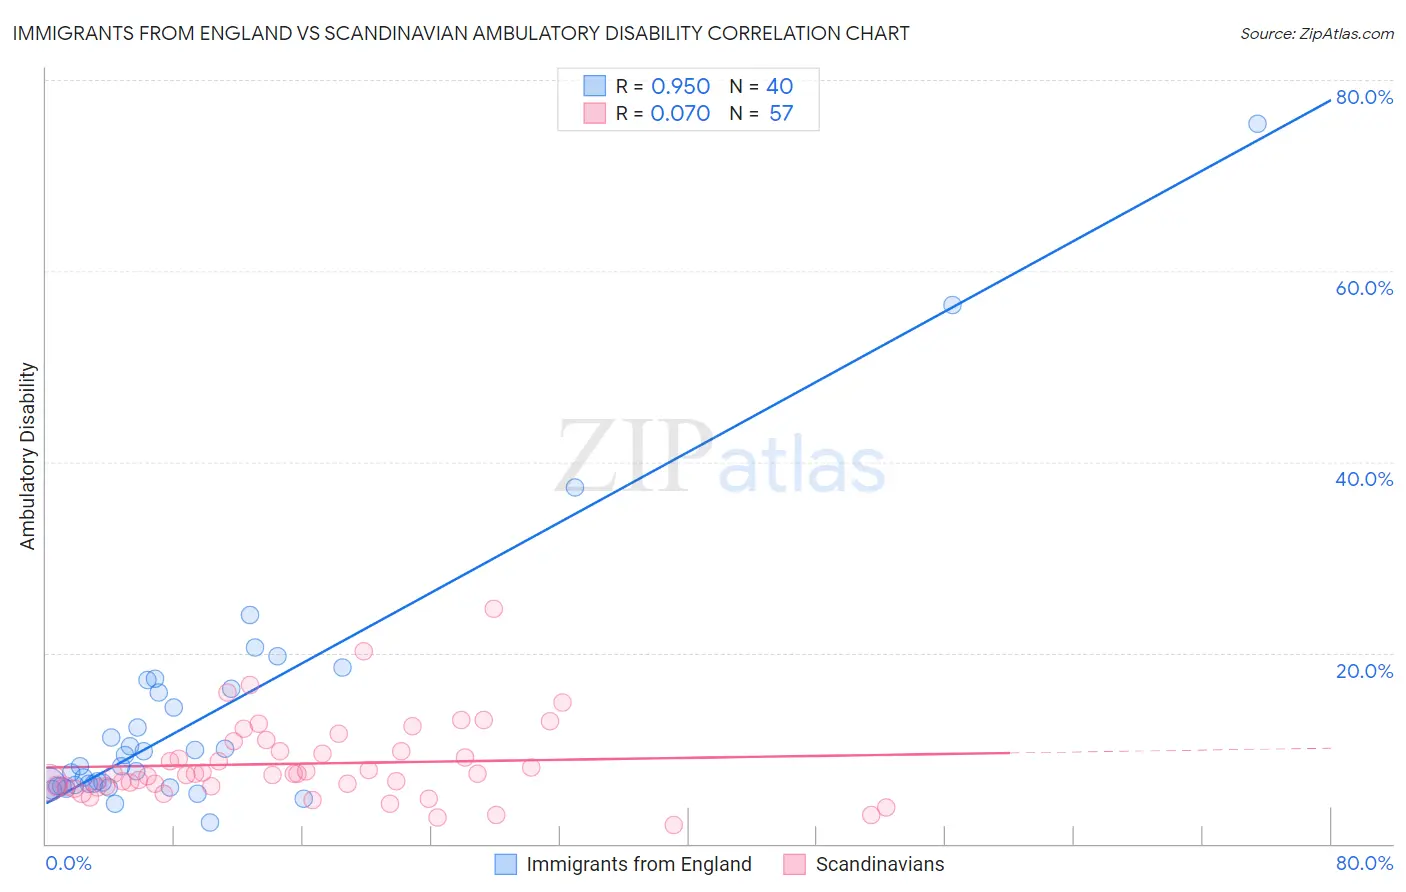
Immigrants from England vs Scandinavian Ambulatory Disability Correlation Chart
The statistical analysis conducted on geographies consisting of 391,842,020 people shows a perfect positive correlation between the proportion of Immigrants from England and percentage of population with ambulatory disability in the United States with a correlation coefficient (R) of 0.950 and weighted average of 6.1%. Similarly, the statistical analysis conducted on geographies consisting of 472,401,593 people shows a slight positive correlation between the proportion of Scandinavians and percentage of population with ambulatory disability in the United States with a correlation coefficient (R) of 0.070 and weighted average of 6.1%, a difference of 0.050%.
Ambulatory Disability Correlation Summary
| Measurement | Immigrants from England | Scandinavian |
| Minimum | 2.3% | 1.9% |
| Maximum | 75.4% | 24.6% |
| Range | 73.1% | 22.7% |
| Mean | 13.3% | 8.4% |
| Median | 8.2% | 7.3% |
| Interquartile 25% (IQ1) | 6.1% | 6.0% |
| Interquartile 75% (IQ3) | 16.0% | 10.2% |
| Interquartile Range (IQR) | 9.9% | 4.2% |
| Standard Deviation (Sample) | 14.1% | 4.2% |
| Standard Deviation (Population) | 13.9% | 4.2% |
Demographics Similar to Immigrants from England and Scandinavians by Ambulatory Disability
In terms of ambulatory disability, the demographic groups most similar to Immigrants from England are Immigrants from North America (6.1%, a difference of 0.010%), Austrian (6.1%, a difference of 0.070%), Immigrants from Nicaragua (6.1%, a difference of 0.080%), Vietnamese (6.1%, a difference of 0.10%), and Swiss (6.1%, a difference of 0.12%). Similarly, the demographic groups most similar to Scandinavians are Austrian (6.1%, a difference of 0.020%), Immigrants from Nicaragua (6.1%, a difference of 0.030%), Immigrants from North America (6.1%, a difference of 0.060%), Swiss (6.1%, a difference of 0.080%), and Serbian (6.1%, a difference of 0.090%).
| Demographics | Rating | Rank | Ambulatory Disability |
| Immigrants | Oceania | 60.7 /100 | #167 | Good 6.1% |
| Ecuadorians | 60.5 /100 | #168 | Good 6.1% |
| Immigrants | Southern Europe | 58.1 /100 | #169 | Average 6.1% |
| Immigrants | Ecuador | 53.8 /100 | #170 | Average 6.1% |
| Moroccans | 52.6 /100 | #171 | Average 6.1% |
| Immigrants | Burma/Myanmar | 52.2 /100 | #172 | Average 6.1% |
| Croatians | 51.2 /100 | #173 | Average 6.1% |
| Immigrants | Canada | 50.0 /100 | #174 | Average 6.1% |
| Vietnamese | 47.2 /100 | #175 | Average 6.1% |
| Immigrants | North America | 45.6 /100 | #176 | Average 6.1% |
| Immigrants | England | 45.4 /100 | #177 | Average 6.1% |
| Scandinavians | 44.5 /100 | #178 | Average 6.1% |
| Austrians | 44.1 /100 | #179 | Average 6.1% |
| Immigrants | Nicaragua | 43.9 /100 | #180 | Average 6.1% |
| Swiss | 43.1 /100 | #181 | Average 6.1% |
| Serbians | 42.8 /100 | #182 | Average 6.1% |
| Immigrants | Thailand | 42.2 /100 | #183 | Average 6.1% |
| Immigrants | Ghana | 41.2 /100 | #184 | Average 6.1% |
| Immigrants | Bosnia and Herzegovina | 37.2 /100 | #185 | Fair 6.2% |
| Europeans | 36.2 /100 | #186 | Fair 6.2% |
| Carpatho Rusyns | 35.3 /100 | #187 | Fair 6.2% |