Immigrants from England vs Hawaiian Ambulatory Disability
COMPARE
Immigrants from England
Hawaiian
Ambulatory Disability
Ambulatory Disability Comparison
Immigrants from England
Hawaiians
6.1%
AMBULATORY DISABILITY
45.4/ 100
METRIC RATING
177th/ 347
METRIC RANK
6.5%
AMBULATORY DISABILITY
0.9/ 100
METRIC RATING
251st/ 347
METRIC RANK
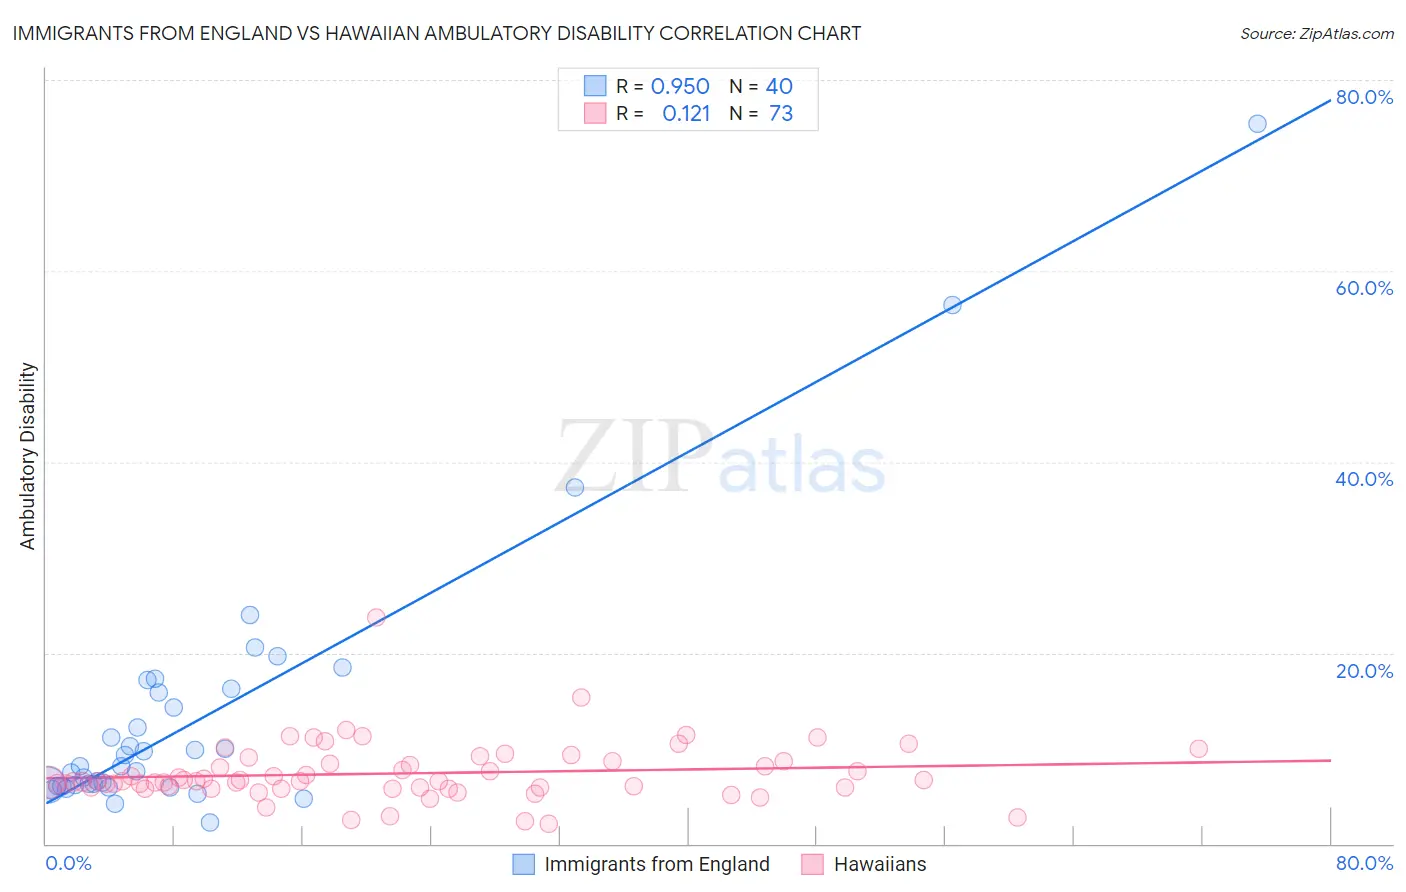
Immigrants from England vs Hawaiian Ambulatory Disability Correlation Chart
The statistical analysis conducted on geographies consisting of 391,842,020 people shows a perfect positive correlation between the proportion of Immigrants from England and percentage of population with ambulatory disability in the United States with a correlation coefficient (R) of 0.950 and weighted average of 6.1%. Similarly, the statistical analysis conducted on geographies consisting of 327,430,219 people shows a poor positive correlation between the proportion of Hawaiians and percentage of population with ambulatory disability in the United States with a correlation coefficient (R) of 0.121 and weighted average of 6.5%, a difference of 6.0%.
Ambulatory Disability Correlation Summary
| Measurement | Immigrants from England | Hawaiian |
| Minimum | 2.3% | 2.1% |
| Maximum | 75.4% | 23.7% |
| Range | 73.1% | 21.6% |
| Mean | 13.3% | 7.4% |
| Median | 8.2% | 6.5% |
| Interquartile 25% (IQ1) | 6.1% | 5.9% |
| Interquartile 75% (IQ3) | 16.0% | 8.7% |
| Interquartile Range (IQR) | 9.9% | 2.8% |
| Standard Deviation (Sample) | 14.1% | 3.1% |
| Standard Deviation (Population) | 13.9% | 3.1% |
Similar Demographics by Ambulatory Disability
Demographics Similar to Immigrants from England by Ambulatory Disability
In terms of ambulatory disability, the demographic groups most similar to Immigrants from England are Immigrants from North America (6.1%, a difference of 0.010%), Scandinavian (6.1%, a difference of 0.050%), Austrian (6.1%, a difference of 0.070%), Immigrants from Nicaragua (6.1%, a difference of 0.080%), and Vietnamese (6.1%, a difference of 0.10%).
| Demographics | Rating | Rank | Ambulatory Disability |
| Immigrants | Ecuador | 53.8 /100 | #170 | Average 6.1% |
| Moroccans | 52.6 /100 | #171 | Average 6.1% |
| Immigrants | Burma/Myanmar | 52.2 /100 | #172 | Average 6.1% |
| Croatians | 51.2 /100 | #173 | Average 6.1% |
| Immigrants | Canada | 50.0 /100 | #174 | Average 6.1% |
| Vietnamese | 47.2 /100 | #175 | Average 6.1% |
| Immigrants | North America | 45.6 /100 | #176 | Average 6.1% |
| Immigrants | England | 45.4 /100 | #177 | Average 6.1% |
| Scandinavians | 44.5 /100 | #178 | Average 6.1% |
| Austrians | 44.1 /100 | #179 | Average 6.1% |
| Immigrants | Nicaragua | 43.9 /100 | #180 | Average 6.1% |
| Swiss | 43.1 /100 | #181 | Average 6.1% |
| Serbians | 42.8 /100 | #182 | Average 6.1% |
| Immigrants | Thailand | 42.2 /100 | #183 | Average 6.1% |
| Immigrants | Ghana | 41.2 /100 | #184 | Average 6.1% |
Demographics Similar to Hawaiians by Ambulatory Disability
In terms of ambulatory disability, the demographic groups most similar to Hawaiians are Chinese (6.5%, a difference of 0.18%), Immigrants from Bahamas (6.5%, a difference of 0.20%), Scottish (6.5%, a difference of 0.25%), Native Hawaiian (6.5%, a difference of 0.26%), and Belizean (6.5%, a difference of 0.41%).
| Demographics | Rating | Rank | Ambulatory Disability |
| Immigrants | Panama | 1.5 /100 | #244 | Tragic 6.5% |
| Tlingit-Haida | 1.5 /100 | #245 | Tragic 6.5% |
| Armenians | 1.5 /100 | #246 | Tragic 6.5% |
| Immigrants | Cuba | 1.4 /100 | #247 | Tragic 6.5% |
| Immigrants | Portugal | 1.4 /100 | #248 | Tragic 6.5% |
| Native Hawaiians | 1.1 /100 | #249 | Tragic 6.5% |
| Chinese | 1.0 /100 | #250 | Tragic 6.5% |
| Hawaiians | 0.9 /100 | #251 | Tragic 6.5% |
| Immigrants | Bahamas | 0.8 /100 | #252 | Tragic 6.5% |
| Scottish | 0.7 /100 | #253 | Tragic 6.5% |
| Belizeans | 0.7 /100 | #254 | Tragic 6.5% |
| Welsh | 0.6 /100 | #255 | Tragic 6.5% |
| Immigrants | Uzbekistan | 0.6 /100 | #256 | Tragic 6.5% |
| Bermudans | 0.5 /100 | #257 | Tragic 6.5% |
| Spanish American Indians | 0.5 /100 | #258 | Tragic 6.5% |