Immigrants from Egypt vs Pueblo 1st Grade
COMPARE
Immigrants from Egypt
Pueblo
1st Grade
1st Grade Comparison
Immigrants from Egypt
Pueblo
97.8%
1ST GRADE
22.6/ 100
METRIC RATING
200th/ 347
METRIC RANK
98.4%
1ST GRADE
99.8/ 100
METRIC RATING
52nd/ 347
METRIC RANK
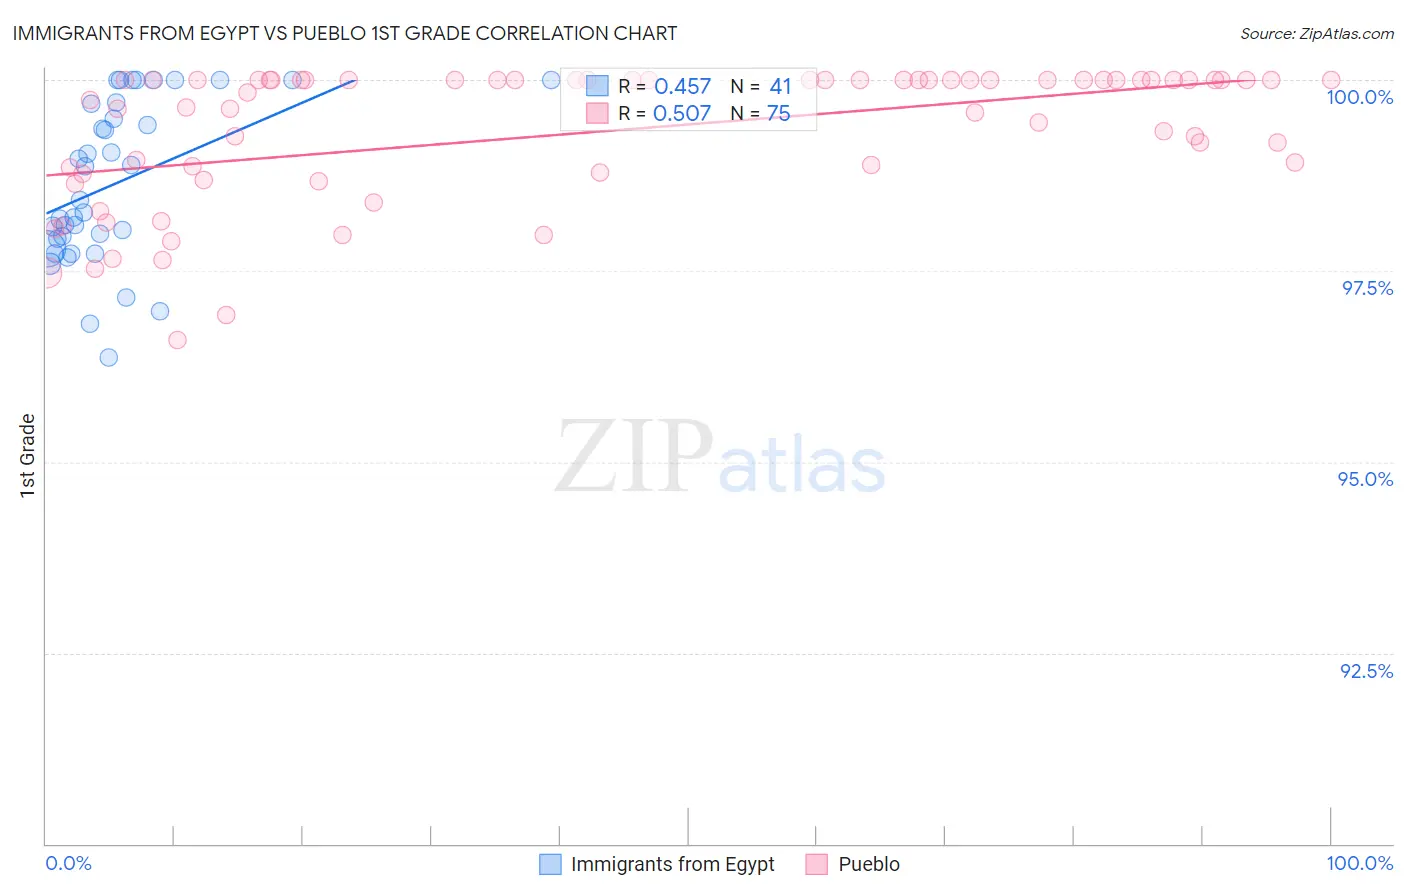
Immigrants from Egypt vs Pueblo 1st Grade Correlation Chart
The statistical analysis conducted on geographies consisting of 245,485,794 people shows a moderate positive correlation between the proportion of Immigrants from Egypt and percentage of population with at least 1st grade education in the United States with a correlation coefficient (R) of 0.457 and weighted average of 97.8%. Similarly, the statistical analysis conducted on geographies consisting of 120,087,340 people shows a substantial positive correlation between the proportion of Pueblo and percentage of population with at least 1st grade education in the United States with a correlation coefficient (R) of 0.507 and weighted average of 98.4%, a difference of 0.59%.
1st Grade Correlation Summary
| Measurement | Immigrants from Egypt | Pueblo |
| Minimum | 96.4% | 96.6% |
| Maximum | 100.0% | 100.0% |
| Range | 3.6% | 3.4% |
| Mean | 98.6% | 99.3% |
| Median | 98.4% | 100.0% |
| Interquartile 25% (IQ1) | 97.9% | 98.8% |
| Interquartile 75% (IQ3) | 99.7% | 100.0% |
| Interquartile Range (IQR) | 1.8% | 1.2% |
| Standard Deviation (Sample) | 1.0% | 0.90% |
| Standard Deviation (Population) | 1.0% | 0.90% |
Similar Demographics by 1st Grade
Demographics Similar to Immigrants from Egypt by 1st Grade
In terms of 1st grade, the demographic groups most similar to Immigrants from Egypt are Tohono O'odham (97.8%, a difference of 0.0%), Yuman (97.8%, a difference of 0.010%), Immigrants from Lebanon (97.8%, a difference of 0.010%), Immigrants from Kenya (97.8%, a difference of 0.020%), and Guamanian/Chamorro (97.8%, a difference of 0.020%).
| Demographics | Rating | Rank | 1st Grade |
| Immigrants | Taiwan | 29.4 /100 | #193 | Fair 97.9% |
| Mongolians | 29.2 /100 | #194 | Fair 97.9% |
| Hawaiians | 28.8 /100 | #195 | Fair 97.9% |
| Immigrants | Kenya | 26.3 /100 | #196 | Fair 97.8% |
| Guamanians/Chamorros | 26.2 /100 | #197 | Fair 97.8% |
| Yuman | 24.4 /100 | #198 | Fair 97.8% |
| Tohono O'odham | 23.2 /100 | #199 | Fair 97.8% |
| Immigrants | Egypt | 22.6 /100 | #200 | Fair 97.8% |
| Immigrants | Lebanon | 20.1 /100 | #201 | Fair 97.8% |
| Immigrants | Ukraine | 19.2 /100 | #202 | Poor 97.8% |
| Immigrants | Southern Europe | 18.2 /100 | #203 | Poor 97.8% |
| Immigrants | Uganda | 18.2 /100 | #204 | Poor 97.8% |
| Immigrants | Chile | 17.7 /100 | #205 | Poor 97.8% |
| Immigrants | Albania | 17.3 /100 | #206 | Poor 97.8% |
| Africans | 16.5 /100 | #207 | Poor 97.8% |
Demographics Similar to Pueblo by 1st Grade
In terms of 1st grade, the demographic groups most similar to Pueblo are Celtic (98.4%, a difference of 0.0%), White/Caucasian (98.4%, a difference of 0.0%), Estonian (98.4%, a difference of 0.0%), Kiowa (98.4%, a difference of 0.0%), and Australian (98.4%, a difference of 0.0%).
| Demographics | Rating | Rank | 1st Grade |
| Belgians | 99.9 /100 | #45 | Exceptional 98.4% |
| Hungarians | 99.9 /100 | #46 | Exceptional 98.4% |
| Ottawa | 99.8 /100 | #47 | Exceptional 98.4% |
| Czechoslovakians | 99.8 /100 | #48 | Exceptional 98.4% |
| Celtics | 99.8 /100 | #49 | Exceptional 98.4% |
| Whites/Caucasians | 99.8 /100 | #50 | Exceptional 98.4% |
| Estonians | 99.8 /100 | #51 | Exceptional 98.4% |
| Pueblo | 99.8 /100 | #52 | Exceptional 98.4% |
| Kiowa | 99.8 /100 | #53 | Exceptional 98.4% |
| Australians | 99.8 /100 | #54 | Exceptional 98.4% |
| Immigrants | Scotland | 99.8 /100 | #55 | Exceptional 98.4% |
| Americans | 99.8 /100 | #56 | Exceptional 98.4% |
| Austrians | 99.8 /100 | #57 | Exceptional 98.4% |
| New Zealanders | 99.7 /100 | #58 | Exceptional 98.4% |
| Creek | 99.7 /100 | #59 | Exceptional 98.4% |