Immigrants from Ecuador vs Canadian Self-Care Disability
COMPARE
Immigrants from Ecuador
Canadian
Self-Care Disability
Self-Care Disability Comparison
Immigrants from Ecuador
Canadians
2.6%
SELF-CARE DISABILITY
2.5/ 100
METRIC RATING
230th/ 347
METRIC RANK
2.5%
SELF-CARE DISABILITY
58.8/ 100
METRIC RATING
166th/ 347
METRIC RANK
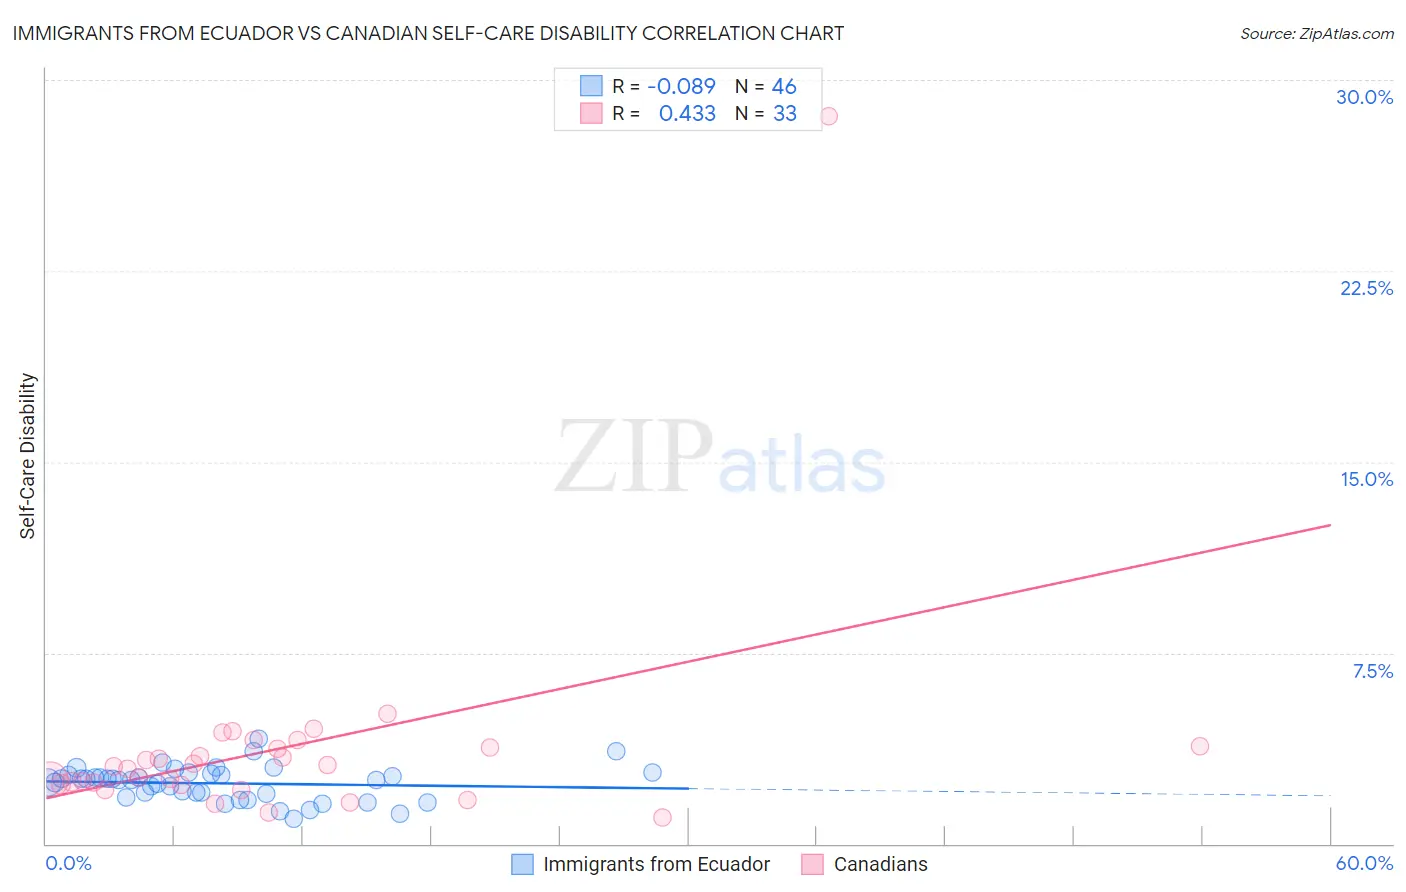
Immigrants from Ecuador vs Canadian Self-Care Disability Correlation Chart
The statistical analysis conducted on geographies consisting of 270,835,557 people shows a slight negative correlation between the proportion of Immigrants from Ecuador and percentage of population with self-care disability in the United States with a correlation coefficient (R) of -0.089 and weighted average of 2.6%. Similarly, the statistical analysis conducted on geographies consisting of 436,894,568 people shows a moderate positive correlation between the proportion of Canadians and percentage of population with self-care disability in the United States with a correlation coefficient (R) of 0.433 and weighted average of 2.5%, a difference of 4.8%.
Self-Care Disability Correlation Summary
| Measurement | Immigrants from Ecuador | Canadian |
| Minimum | 0.96% | 1.1% |
| Maximum | 4.1% | 28.6% |
| Range | 3.1% | 27.5% |
| Mean | 2.4% | 3.7% |
| Median | 2.5% | 3.0% |
| Interquartile 25% (IQ1) | 2.0% | 2.3% |
| Interquartile 75% (IQ3) | 2.7% | 3.8% |
| Interquartile Range (IQR) | 0.76% | 1.5% |
| Standard Deviation (Sample) | 0.66% | 4.6% |
| Standard Deviation (Population) | 0.65% | 4.5% |
Similar Demographics by Self-Care Disability
Demographics Similar to Immigrants from Ecuador by Self-Care Disability
In terms of self-care disability, the demographic groups most similar to Immigrants from Ecuador are Guamanian/Chamorro (2.6%, a difference of 0.010%), Immigrants from Philippines (2.6%, a difference of 0.080%), Guatemalan (2.6%, a difference of 0.080%), Immigrants from Guatemala (2.6%, a difference of 0.15%), and Chinese (2.6%, a difference of 0.16%).
| Demographics | Rating | Rank | Self-Care Disability |
| French Canadians | 3.8 /100 | #223 | Tragic 2.6% |
| Osage | 3.6 /100 | #224 | Tragic 2.6% |
| Iraqis | 3.2 /100 | #225 | Tragic 2.6% |
| Chinese | 2.9 /100 | #226 | Tragic 2.6% |
| Immigrants | Philippines | 2.7 /100 | #227 | Tragic 2.6% |
| Guatemalans | 2.7 /100 | #228 | Tragic 2.6% |
| Guamanians/Chamorros | 2.5 /100 | #229 | Tragic 2.6% |
| Immigrants | Ecuador | 2.5 /100 | #230 | Tragic 2.6% |
| Immigrants | Guatemala | 2.2 /100 | #231 | Tragic 2.6% |
| Albanians | 2.2 /100 | #232 | Tragic 2.6% |
| Liberians | 2.1 /100 | #233 | Tragic 2.6% |
| Vietnamese | 2.1 /100 | #234 | Tragic 2.6% |
| Bahamians | 2.0 /100 | #235 | Tragic 2.6% |
| Bermudans | 1.9 /100 | #236 | Tragic 2.6% |
| Immigrants | Senegal | 1.6 /100 | #237 | Tragic 2.6% |
Demographics Similar to Canadians by Self-Care Disability
In terms of self-care disability, the demographic groups most similar to Canadians are Syrian (2.5%, a difference of 0.010%), Immigrants from Vietnam (2.5%, a difference of 0.030%), Immigrants from Greece (2.5%, a difference of 0.070%), Ute (2.5%, a difference of 0.080%), and Immigrants from Somalia (2.5%, a difference of 0.14%).
| Demographics | Rating | Rank | Self-Care Disability |
| Immigrants | Italy | 68.5 /100 | #159 | Good 2.4% |
| Finns | 67.0 /100 | #160 | Good 2.4% |
| Lebanese | 66.5 /100 | #161 | Good 2.4% |
| Somalis | 63.7 /100 | #162 | Good 2.5% |
| German Russians | 62.7 /100 | #163 | Good 2.5% |
| Immigrants | Vietnam | 59.3 /100 | #164 | Average 2.5% |
| Syrians | 59.0 /100 | #165 | Average 2.5% |
| Canadians | 58.8 /100 | #166 | Average 2.5% |
| Immigrants | Greece | 57.3 /100 | #167 | Average 2.5% |
| Ute | 57.1 /100 | #168 | Average 2.5% |
| Immigrants | Somalia | 55.9 /100 | #169 | Average 2.5% |
| Scottish | 54.3 /100 | #170 | Average 2.5% |
| Pennsylvania Germans | 53.5 /100 | #171 | Average 2.5% |
| Czechoslovakians | 53.5 /100 | #172 | Average 2.5% |
| Immigrants | Burma/Myanmar | 52.8 /100 | #173 | Average 2.5% |