Immigrants from Greece vs Korean Female Disability
COMPARE
Immigrants from Greece
Korean
Female Disability
Female Disability Comparison
Immigrants from Greece
Koreans
11.7%
FEMALE DISABILITY
98.2/ 100
METRIC RATING
106th/ 347
METRIC RANK
11.7%
FEMALE DISABILITY
99.0/ 100
METRIC RATING
97th/ 347
METRIC RANK
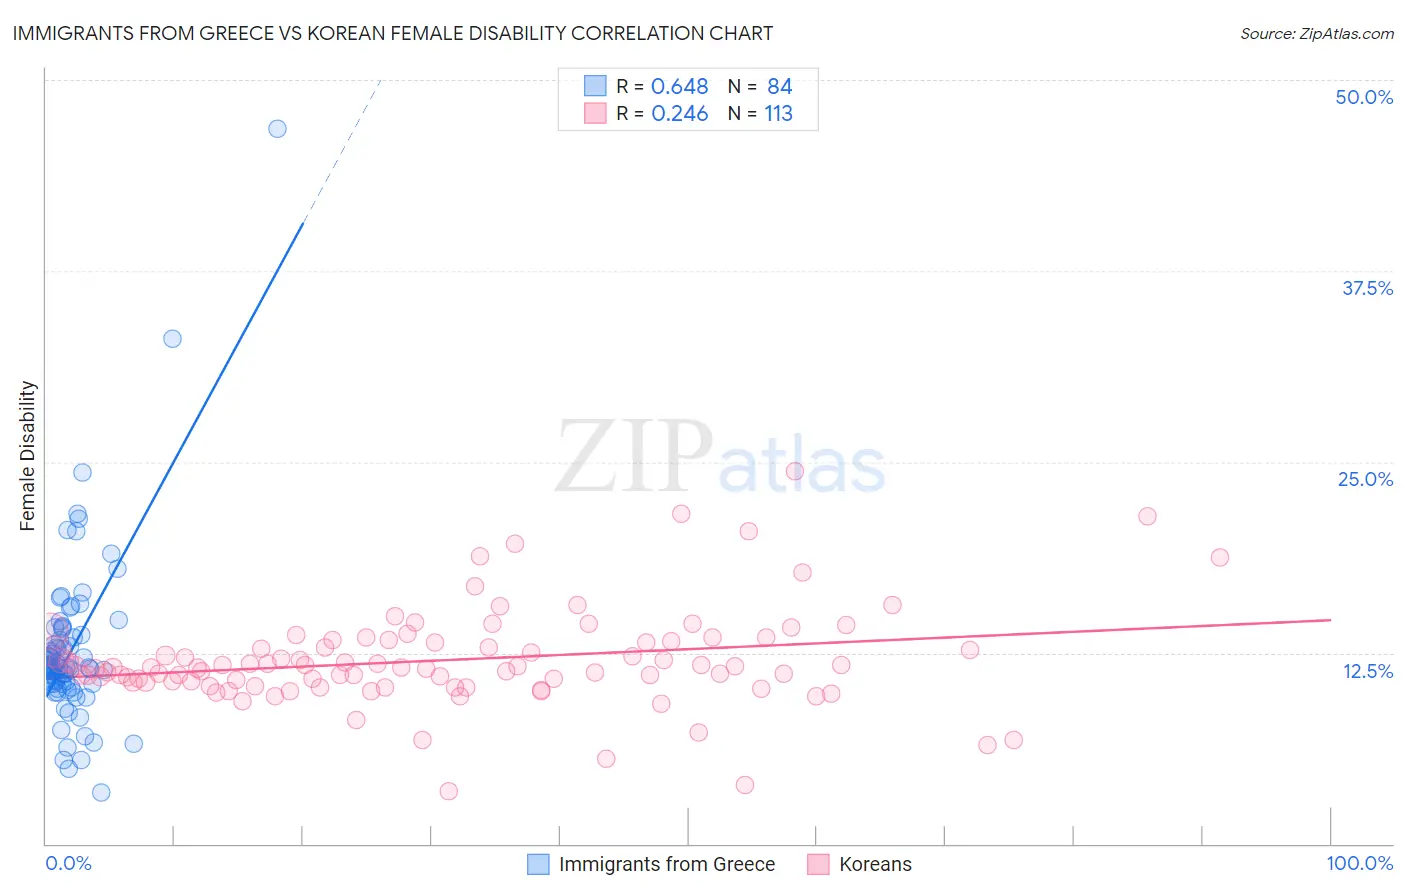
Immigrants from Greece vs Korean Female Disability Correlation Chart
The statistical analysis conducted on geographies consisting of 216,876,601 people shows a significant positive correlation between the proportion of Immigrants from Greece and percentage of females with a disability in the United States with a correlation coefficient (R) of 0.648 and weighted average of 11.7%. Similarly, the statistical analysis conducted on geographies consisting of 510,799,967 people shows a weak positive correlation between the proportion of Koreans and percentage of females with a disability in the United States with a correlation coefficient (R) of 0.246 and weighted average of 11.7%, a difference of 0.56%.
Female Disability Correlation Summary
| Measurement | Immigrants from Greece | Korean |
| Minimum | 3.4% | 3.4% |
| Maximum | 46.8% | 24.4% |
| Range | 43.5% | 21.0% |
| Mean | 12.7% | 12.0% |
| Median | 11.6% | 11.5% |
| Interquartile 25% (IQ1) | 10.5% | 10.6% |
| Interquartile 75% (IQ3) | 13.9% | 13.2% |
| Interquartile Range (IQR) | 3.4% | 2.6% |
| Standard Deviation (Sample) | 5.8% | 3.2% |
| Standard Deviation (Population) | 5.7% | 3.2% |
Demographics Similar to Immigrants from Greece and Koreans by Female Disability
In terms of female disability, the demographic groups most similar to Immigrants from Greece are Latvian (11.7%, a difference of 0.020%), Australian (11.7%, a difference of 0.030%), Immigrants from Western Asia (11.7%, a difference of 0.040%), Immigrants from Eastern Africa (11.7%, a difference of 0.050%), and New Zealander (11.7%, a difference of 0.050%). Similarly, the demographic groups most similar to Koreans are Immigrants from Russia (11.7%, a difference of 0.0%), Uruguayan (11.7%, a difference of 0.14%), Immigrants from Philippines (11.7%, a difference of 0.35%), Immigrants from Uruguay (11.7%, a difference of 0.40%), and Immigrants from Costa Rica (11.7%, a difference of 0.42%).
| Demographics | Rating | Rank | Female Disability |
| Immigrants | Zimbabwe | 99.5 /100 | #91 | Exceptional 11.6% |
| Immigrants | Czechoslovakia | 99.5 /100 | #92 | Exceptional 11.6% |
| Immigrants | Sierra Leone | 99.4 /100 | #93 | Exceptional 11.6% |
| Immigrants | Brazil | 99.4 /100 | #94 | Exceptional 11.6% |
| Immigrants | Northern Europe | 99.4 /100 | #95 | Exceptional 11.6% |
| Immigrants | Russia | 99.0 /100 | #96 | Exceptional 11.7% |
| Koreans | 99.0 /100 | #97 | Exceptional 11.7% |
| Uruguayans | 98.8 /100 | #98 | Exceptional 11.7% |
| Immigrants | Philippines | 98.6 /100 | #99 | Exceptional 11.7% |
| Immigrants | Uruguay | 98.5 /100 | #100 | Exceptional 11.7% |
| Immigrants | Costa Rica | 98.4 /100 | #101 | Exceptional 11.7% |
| Immigrants | South Eastern Asia | 98.4 /100 | #102 | Exceptional 11.7% |
| Immigrants | Eastern Africa | 98.3 /100 | #103 | Exceptional 11.7% |
| Immigrants | Western Asia | 98.3 /100 | #104 | Exceptional 11.7% |
| Australians | 98.3 /100 | #105 | Exceptional 11.7% |
| Immigrants | Greece | 98.2 /100 | #106 | Exceptional 11.7% |
| Latvians | 98.2 /100 | #107 | Exceptional 11.7% |
| New Zealanders | 98.1 /100 | #108 | Exceptional 11.7% |
| Immigrants | Immigrants | 98.1 /100 | #109 | Exceptional 11.7% |
| Soviet Union | 98.1 /100 | #110 | Exceptional 11.7% |
| Costa Ricans | 98.1 /100 | #111 | Exceptional 11.7% |