Immigrants from Eastern Asia vs Turkish Female Disability
COMPARE
Immigrants from Eastern Asia
Turkish
Female Disability
Female Disability Comparison
Immigrants from Eastern Asia
Turks
10.7%
FEMALE DISABILITY
100.0/ 100
METRIC RATING
13th/ 347
METRIC RANK
11.1%
FEMALE DISABILITY
100.0/ 100
METRIC RATING
30th/ 347
METRIC RANK
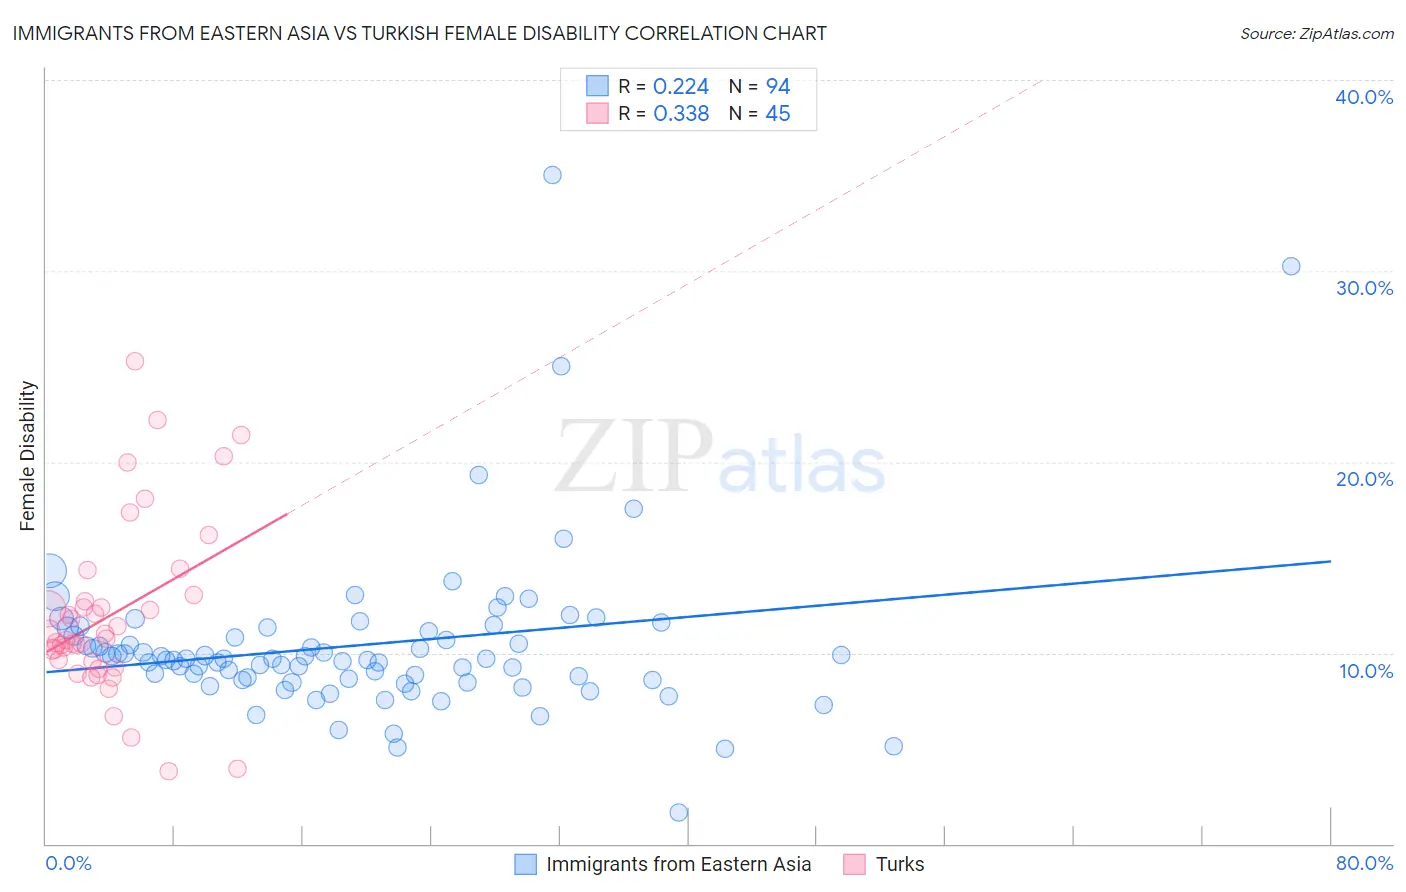
Immigrants from Eastern Asia vs Turkish Female Disability Correlation Chart
The statistical analysis conducted on geographies consisting of 499,845,203 people shows a weak positive correlation between the proportion of Immigrants from Eastern Asia and percentage of females with a disability in the United States with a correlation coefficient (R) of 0.224 and weighted average of 10.7%. Similarly, the statistical analysis conducted on geographies consisting of 271,848,470 people shows a mild positive correlation between the proportion of Turks and percentage of females with a disability in the United States with a correlation coefficient (R) of 0.338 and weighted average of 11.1%, a difference of 3.8%.
Female Disability Correlation Summary
| Measurement | Immigrants from Eastern Asia | Turkish |
| Minimum | 1.6% | 3.8% |
| Maximum | 35.0% | 25.3% |
| Range | 33.4% | 21.5% |
| Mean | 10.4% | 12.0% |
| Median | 9.7% | 10.7% |
| Interquartile 25% (IQ1) | 8.6% | 9.4% |
| Interquartile 75% (IQ3) | 11.2% | 12.8% |
| Interquartile Range (IQR) | 2.6% | 3.5% |
| Standard Deviation (Sample) | 4.4% | 4.5% |
| Standard Deviation (Population) | 4.4% | 4.5% |
Demographics Similar to Immigrants from Eastern Asia and Turks by Female Disability
In terms of female disability, the demographic groups most similar to Immigrants from Eastern Asia are Immigrants from China (10.7%, a difference of 0.040%), Immigrants from Israel (10.7%, a difference of 0.070%), Immigrants from Korea (10.6%, a difference of 0.49%), Burmese (10.7%, a difference of 0.54%), and Okinawan (10.8%, a difference of 0.61%). Similarly, the demographic groups most similar to Turks are Immigrants from Malaysia (11.1%, a difference of 0.0%), Egyptian (11.1%, a difference of 0.070%), Immigrants from Kuwait (11.1%, a difference of 0.10%), Immigrants from Turkey (11.1%, a difference of 0.34%), and Argentinean (11.0%, a difference of 0.74%).
| Demographics | Rating | Rank | Female Disability |
| Immigrants | Korea | 100.0 /100 | #11 | Exceptional 10.6% |
| Immigrants | Israel | 100.0 /100 | #12 | Exceptional 10.7% |
| Immigrants | Eastern Asia | 100.0 /100 | #13 | Exceptional 10.7% |
| Immigrants | China | 100.0 /100 | #14 | Exceptional 10.7% |
| Burmese | 100.0 /100 | #15 | Exceptional 10.7% |
| Okinawans | 100.0 /100 | #16 | Exceptional 10.8% |
| Indians (Asian) | 100.0 /100 | #17 | Exceptional 10.8% |
| Immigrants | Iran | 100.0 /100 | #18 | Exceptional 10.8% |
| Immigrants | Venezuela | 100.0 /100 | #19 | Exceptional 10.9% |
| Immigrants | Pakistan | 100.0 /100 | #20 | Exceptional 10.9% |
| Asians | 100.0 /100 | #21 | Exceptional 10.9% |
| Immigrants | Sri Lanka | 100.0 /100 | #22 | Exceptional 10.9% |
| Venezuelans | 100.0 /100 | #23 | Exceptional 11.0% |
| Immigrants | Argentina | 100.0 /100 | #24 | Exceptional 11.0% |
| Immigrants | Asia | 100.0 /100 | #25 | Exceptional 11.0% |
| Argentineans | 100.0 /100 | #26 | Exceptional 11.0% |
| Immigrants | Turkey | 100.0 /100 | #27 | Exceptional 11.1% |
| Egyptians | 100.0 /100 | #28 | Exceptional 11.1% |
| Immigrants | Malaysia | 100.0 /100 | #29 | Exceptional 11.1% |
| Turks | 100.0 /100 | #30 | Exceptional 11.1% |
| Immigrants | Kuwait | 100.0 /100 | #31 | Exceptional 11.1% |