Immigrants from Eastern Asia vs Immigrants from Kazakhstan Female Disability
COMPARE
Immigrants from Eastern Asia
Immigrants from Kazakhstan
Female Disability
Female Disability Comparison
Immigrants from Eastern Asia
Immigrants from Kazakhstan
10.7%
FEMALE DISABILITY
100.0/ 100
METRIC RATING
13th/ 347
METRIC RANK
11.8%
FEMALE DISABILITY
97.0/ 100
METRIC RATING
120th/ 347
METRIC RANK
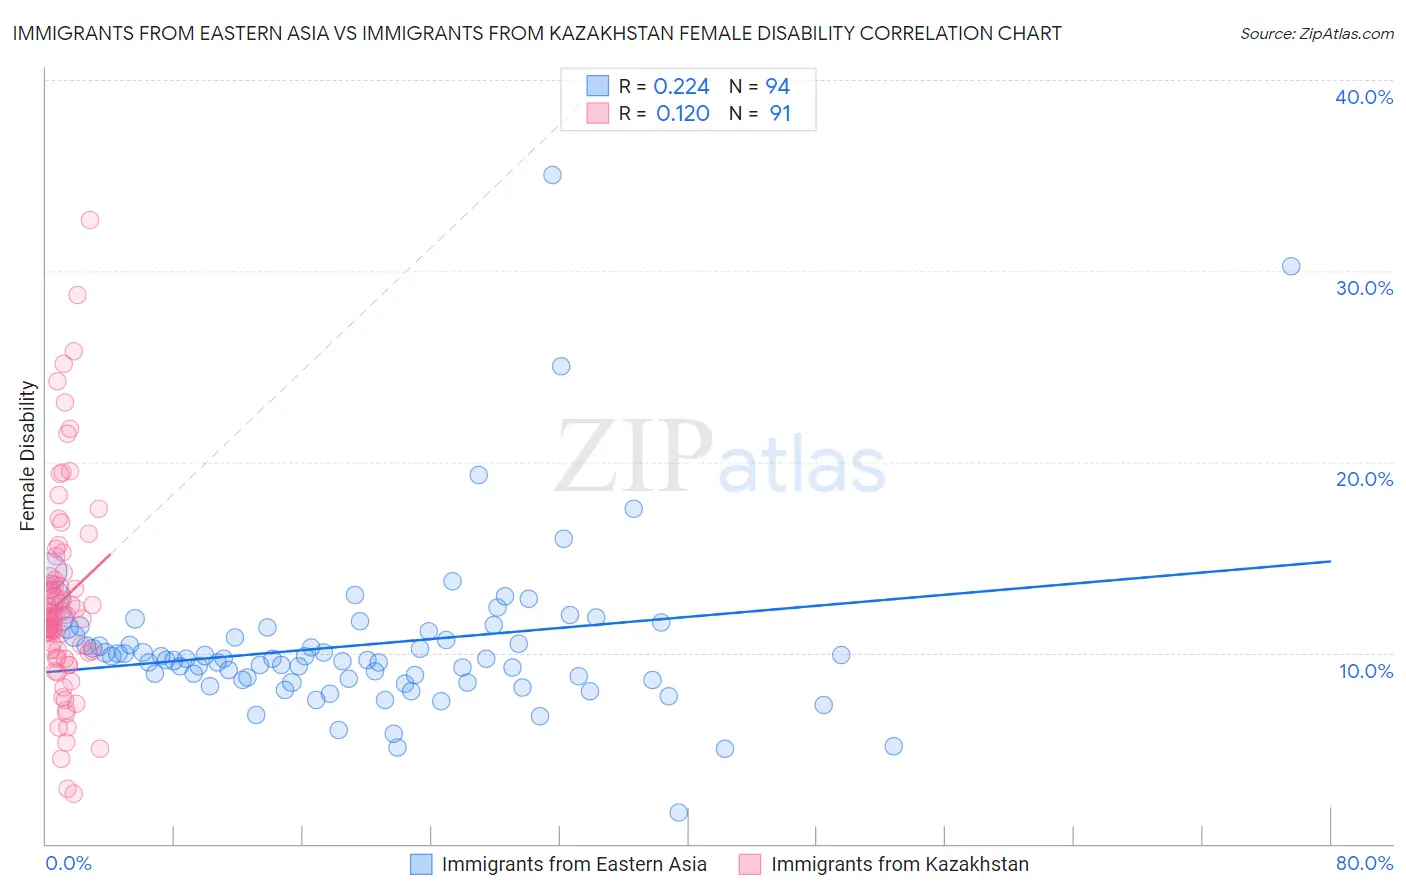
Immigrants from Eastern Asia vs Immigrants from Kazakhstan Female Disability Correlation Chart
The statistical analysis conducted on geographies consisting of 499,845,203 people shows a weak positive correlation between the proportion of Immigrants from Eastern Asia and percentage of females with a disability in the United States with a correlation coefficient (R) of 0.224 and weighted average of 10.7%. Similarly, the statistical analysis conducted on geographies consisting of 124,443,706 people shows a poor positive correlation between the proportion of Immigrants from Kazakhstan and percentage of females with a disability in the United States with a correlation coefficient (R) of 0.120 and weighted average of 11.8%, a difference of 10.4%.
Female Disability Correlation Summary
| Measurement | Immigrants from Eastern Asia | Immigrants from Kazakhstan |
| Minimum | 1.6% | 2.6% |
| Maximum | 35.0% | 32.7% |
| Range | 33.4% | 30.1% |
| Mean | 10.4% | 12.7% |
| Median | 9.7% | 11.9% |
| Interquartile 25% (IQ1) | 8.6% | 10.1% |
| Interquartile 75% (IQ3) | 11.2% | 13.8% |
| Interquartile Range (IQR) | 2.6% | 3.8% |
| Standard Deviation (Sample) | 4.4% | 5.2% |
| Standard Deviation (Population) | 4.4% | 5.2% |
Similar Demographics by Female Disability
Demographics Similar to Immigrants from Eastern Asia by Female Disability
In terms of female disability, the demographic groups most similar to Immigrants from Eastern Asia are Immigrants from China (10.7%, a difference of 0.040%), Immigrants from Israel (10.7%, a difference of 0.070%), Immigrants from Korea (10.6%, a difference of 0.49%), Burmese (10.7%, a difference of 0.54%), and Okinawan (10.8%, a difference of 0.61%).
| Demographics | Rating | Rank | Female Disability |
| Bolivians | 100.0 /100 | #6 | Exceptional 10.4% |
| Immigrants | Singapore | 100.0 /100 | #7 | Exceptional 10.4% |
| Immigrants | South Central Asia | 100.0 /100 | #8 | Exceptional 10.5% |
| Iranians | 100.0 /100 | #9 | Exceptional 10.6% |
| Immigrants | Hong Kong | 100.0 /100 | #10 | Exceptional 10.6% |
| Immigrants | Korea | 100.0 /100 | #11 | Exceptional 10.6% |
| Immigrants | Israel | 100.0 /100 | #12 | Exceptional 10.7% |
| Immigrants | Eastern Asia | 100.0 /100 | #13 | Exceptional 10.7% |
| Immigrants | China | 100.0 /100 | #14 | Exceptional 10.7% |
| Burmese | 100.0 /100 | #15 | Exceptional 10.7% |
| Okinawans | 100.0 /100 | #16 | Exceptional 10.8% |
| Indians (Asian) | 100.0 /100 | #17 | Exceptional 10.8% |
| Immigrants | Iran | 100.0 /100 | #18 | Exceptional 10.8% |
| Immigrants | Venezuela | 100.0 /100 | #19 | Exceptional 10.9% |
| Immigrants | Pakistan | 100.0 /100 | #20 | Exceptional 10.9% |
Demographics Similar to Immigrants from Kazakhstan by Female Disability
In terms of female disability, the demographic groups most similar to Immigrants from Kazakhstan are Immigrants from Netherlands (11.8%, a difference of 0.030%), Immigrants from North Macedonia (11.8%, a difference of 0.040%), Immigrants from Uganda (11.8%, a difference of 0.080%), Immigrants from Eastern Europe (11.8%, a difference of 0.090%), and Immigrants from Nigeria (11.8%, a difference of 0.090%).
| Demographics | Rating | Rank | Female Disability |
| Immigrants | Belarus | 97.8 /100 | #113 | Exceptional 11.8% |
| South Africans | 97.7 /100 | #114 | Exceptional 11.8% |
| Brazilians | 97.7 /100 | #115 | Exceptional 11.8% |
| Immigrants | Morocco | 97.6 /100 | #116 | Exceptional 11.8% |
| Immigrants | Eastern Europe | 97.2 /100 | #117 | Exceptional 11.8% |
| Immigrants | Nigeria | 97.2 /100 | #118 | Exceptional 11.8% |
| Immigrants | Uganda | 97.2 /100 | #119 | Exceptional 11.8% |
| Immigrants | Kazakhstan | 97.0 /100 | #120 | Exceptional 11.8% |
| Immigrants | Netherlands | 96.9 /100 | #121 | Exceptional 11.8% |
| Immigrants | North Macedonia | 96.8 /100 | #122 | Exceptional 11.8% |
| Immigrants | Croatia | 96.7 /100 | #123 | Exceptional 11.8% |
| Russians | 96.5 /100 | #124 | Exceptional 11.8% |
| Immigrants | Italy | 96.4 /100 | #125 | Exceptional 11.8% |
| Immigrants | Europe | 96.2 /100 | #126 | Exceptional 11.8% |
| South American Indians | 95.8 /100 | #127 | Exceptional 11.8% |