Immigrants from Eastern Asia vs Immigrants from Albania Disability Age Over 75
COMPARE
Immigrants from Eastern Asia
Immigrants from Albania
Disability Age Over 75
Disability Age Over 75 Comparison
Immigrants from Eastern Asia
Immigrants from Albania
46.2%
DISABILITY AGE OVER 75
98.9/ 100
METRIC RATING
77th/ 347
METRIC RANK
46.6%
DISABILITY AGE OVER 75
93.2/ 100
METRIC RATING
122nd/ 347
METRIC RANK
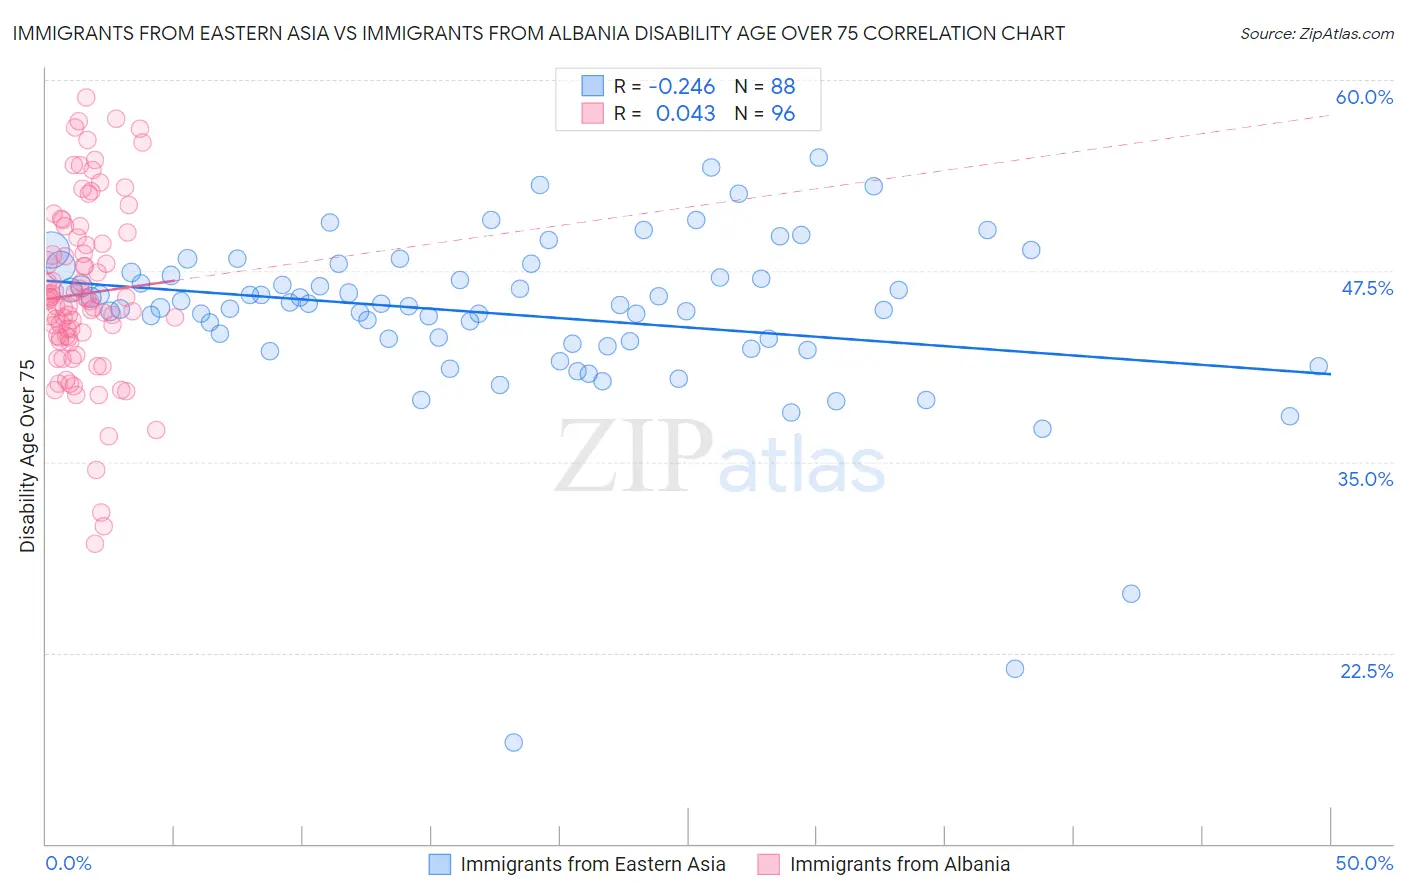
Immigrants from Eastern Asia vs Immigrants from Albania Disability Age Over 75 Correlation Chart
The statistical analysis conducted on geographies consisting of 498,430,406 people shows a weak negative correlation between the proportion of Immigrants from Eastern Asia and percentage of population with a disability over the age of 75 in the United States with a correlation coefficient (R) of -0.246 and weighted average of 46.2%. Similarly, the statistical analysis conducted on geographies consisting of 119,350,943 people shows no correlation between the proportion of Immigrants from Albania and percentage of population with a disability over the age of 75 in the United States with a correlation coefficient (R) of 0.043 and weighted average of 46.6%, a difference of 1.1%.
Disability Age Over 75 Correlation Summary
| Measurement | Immigrants from Eastern Asia | Immigrants from Albania |
| Minimum | 16.7% | 29.7% |
| Maximum | 54.9% | 58.9% |
| Range | 38.3% | 29.2% |
| Mean | 44.7% | 46.0% |
| Median | 45.3% | 45.6% |
| Interquartile 25% (IQ1) | 42.8% | 43.1% |
| Interquartile 75% (IQ3) | 47.3% | 49.5% |
| Interquartile Range (IQR) | 4.5% | 6.3% |
| Standard Deviation (Sample) | 5.8% | 5.8% |
| Standard Deviation (Population) | 5.7% | 5.8% |
Similar Demographics by Disability Age Over 75
Demographics Similar to Immigrants from Eastern Asia by Disability Age Over 75
In terms of disability age over 75, the demographic groups most similar to Immigrants from Eastern Asia are Immigrants from Western Europe (46.2%, a difference of 0.010%), Slavic (46.1%, a difference of 0.040%), Serbian (46.1%, a difference of 0.050%), Swiss (46.2%, a difference of 0.050%), and Soviet Union (46.2%, a difference of 0.050%).
| Demographics | Rating | Rank | Disability Age Over 75 |
| Jordanians | 99.2 /100 | #70 | Exceptional 46.1% |
| Immigrants | Sri Lanka | 99.2 /100 | #71 | Exceptional 46.1% |
| Immigrants | Hungary | 99.1 /100 | #72 | Exceptional 46.1% |
| Cambodians | 99.1 /100 | #73 | Exceptional 46.1% |
| Egyptians | 99.0 /100 | #74 | Exceptional 46.1% |
| Serbians | 99.0 /100 | #75 | Exceptional 46.1% |
| Slavs | 98.9 /100 | #76 | Exceptional 46.1% |
| Immigrants | Eastern Asia | 98.9 /100 | #77 | Exceptional 46.2% |
| Immigrants | Western Europe | 98.8 /100 | #78 | Exceptional 46.2% |
| Swiss | 98.8 /100 | #79 | Exceptional 46.2% |
| Soviet Union | 98.8 /100 | #80 | Exceptional 46.2% |
| New Zealanders | 98.8 /100 | #81 | Exceptional 46.2% |
| Immigrants | Latvia | 98.7 /100 | #82 | Exceptional 46.2% |
| Argentineans | 98.7 /100 | #83 | Exceptional 46.2% |
| Immigrants | Jordan | 98.7 /100 | #84 | Exceptional 46.2% |
Demographics Similar to Immigrants from Albania by Disability Age Over 75
In terms of disability age over 75, the demographic groups most similar to Immigrants from Albania are Scandinavian (46.6%, a difference of 0.050%), Immigrants from Colombia (46.7%, a difference of 0.050%), Immigrants from Nepal (46.6%, a difference of 0.090%), Immigrants from South America (46.7%, a difference of 0.11%), and Canadian (46.6%, a difference of 0.12%).
| Demographics | Rating | Rank | Disability Age Over 75 |
| British | 95.7 /100 | #115 | Exceptional 46.5% |
| Indians (Asian) | 95.7 /100 | #116 | Exceptional 46.5% |
| Hungarians | 95.3 /100 | #117 | Exceptional 46.5% |
| Czechoslovakians | 94.7 /100 | #118 | Exceptional 46.6% |
| Canadians | 94.4 /100 | #119 | Exceptional 46.6% |
| Immigrants | Nepal | 94.1 /100 | #120 | Exceptional 46.6% |
| Scandinavians | 93.6 /100 | #121 | Exceptional 46.6% |
| Immigrants | Albania | 93.2 /100 | #122 | Exceptional 46.6% |
| Immigrants | Colombia | 92.6 /100 | #123 | Exceptional 46.7% |
| Immigrants | South America | 91.8 /100 | #124 | Exceptional 46.7% |
| Colombians | 91.3 /100 | #125 | Exceptional 46.7% |
| Europeans | 91.2 /100 | #126 | Exceptional 46.7% |
| Syrians | 91.1 /100 | #127 | Exceptional 46.7% |
| Icelanders | 90.9 /100 | #128 | Exceptional 46.7% |
| Immigrants | Germany | 90.8 /100 | #129 | Exceptional 46.7% |