Cree vs Immigrants from Israel Disability Age Over 75
COMPARE
Cree
Immigrants from Israel
Disability Age Over 75
Disability Age Over 75 Comparison
Cree
Immigrants from Israel
48.2%
DISABILITY AGE OVER 75
4.2/ 100
METRIC RATING
233rd/ 347
METRIC RANK
45.9%
DISABILITY AGE OVER 75
99.6/ 100
METRIC RATING
58th/ 347
METRIC RANK
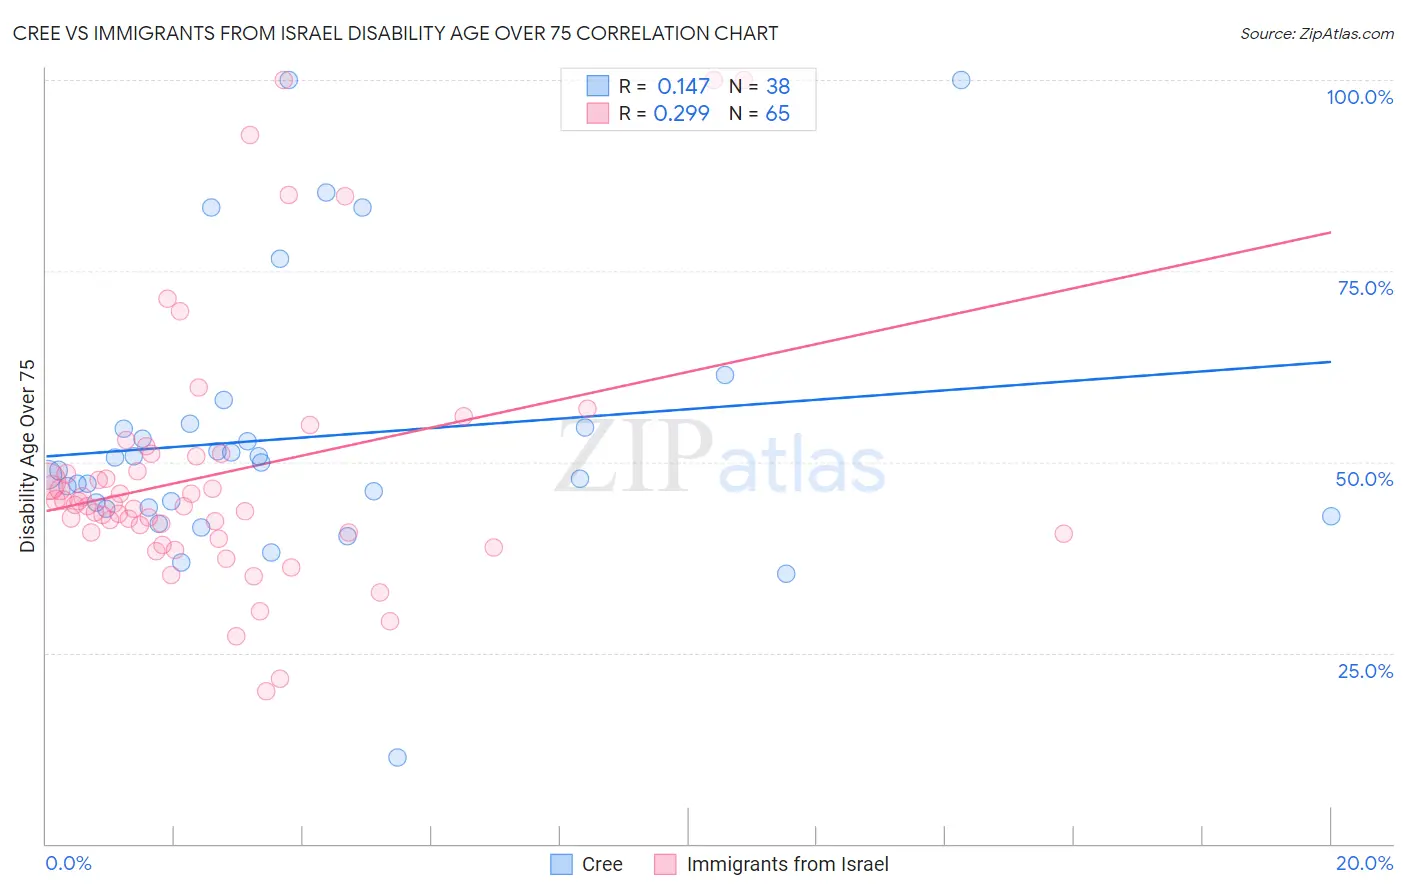
Cree vs Immigrants from Israel Disability Age Over 75 Correlation Chart
The statistical analysis conducted on geographies consisting of 76,193,108 people shows a poor positive correlation between the proportion of Cree and percentage of population with a disability over the age of 75 in the United States with a correlation coefficient (R) of 0.147 and weighted average of 48.2%. Similarly, the statistical analysis conducted on geographies consisting of 209,886,024 people shows a weak positive correlation between the proportion of Immigrants from Israel and percentage of population with a disability over the age of 75 in the United States with a correlation coefficient (R) of 0.299 and weighted average of 45.9%, a difference of 5.0%.
Disability Age Over 75 Correlation Summary
| Measurement | Cree | Immigrants from Israel |
| Minimum | 11.2% | 20.0% |
| Maximum | 100.0% | 100.0% |
| Range | 88.8% | 80.0% |
| Mean | 53.2% | 48.5% |
| Median | 49.4% | 44.4% |
| Interquartile 25% (IQ1) | 44.0% | 40.6% |
| Interquartile 75% (IQ3) | 54.4% | 50.9% |
| Interquartile Range (IQR) | 10.4% | 10.3% |
| Standard Deviation (Sample) | 17.7% | 17.1% |
| Standard Deviation (Population) | 17.5% | 16.9% |
Similar Demographics by Disability Age Over 75
Demographics Similar to Cree by Disability Age Over 75
In terms of disability age over 75, the demographic groups most similar to Cree are Indonesian (48.2%, a difference of 0.0%), Immigrants (48.2%, a difference of 0.020%), Taiwanese (48.2%, a difference of 0.030%), Subsaharan African (48.2%, a difference of 0.060%), and Hmong (48.2%, a difference of 0.070%).
| Demographics | Rating | Rank | Disability Age Over 75 |
| Immigrants | Nonimmigrants | 6.5 /100 | #226 | Tragic 48.0% |
| Zimbabweans | 6.4 /100 | #227 | Tragic 48.1% |
| Immigrants | Liberia | 5.9 /100 | #228 | Tragic 48.1% |
| Spaniards | 5.7 /100 | #229 | Tragic 48.1% |
| Taiwanese | 4.4 /100 | #230 | Tragic 48.2% |
| Immigrants | Immigrants | 4.3 /100 | #231 | Tragic 48.2% |
| Indonesians | 4.2 /100 | #232 | Tragic 48.2% |
| Cree | 4.2 /100 | #233 | Tragic 48.2% |
| Sub-Saharan Africans | 3.8 /100 | #234 | Tragic 48.2% |
| Hmong | 3.8 /100 | #235 | Tragic 48.2% |
| Immigrants | Nicaragua | 3.2 /100 | #236 | Tragic 48.2% |
| Immigrants | St. Vincent and the Grenadines | 3.2 /100 | #237 | Tragic 48.2% |
| Nicaraguans | 3.0 /100 | #238 | Tragic 48.3% |
| Immigrants | Thailand | 2.8 /100 | #239 | Tragic 48.3% |
| Tongans | 2.3 /100 | #240 | Tragic 48.3% |
Demographics Similar to Immigrants from Israel by Disability Age Over 75
In terms of disability age over 75, the demographic groups most similar to Immigrants from Israel are Immigrants from Turkey (45.9%, a difference of 0.0%), Iranian (45.9%, a difference of 0.010%), Immigrants from Europe (45.9%, a difference of 0.010%), Immigrants from Netherlands (45.9%, a difference of 0.020%), and Immigrants from Argentina (45.9%, a difference of 0.030%).
| Demographics | Rating | Rank | Disability Age Over 75 |
| Immigrants | Korea | 99.7 /100 | #51 | Exceptional 45.8% |
| Immigrants | France | 99.7 /100 | #52 | Exceptional 45.8% |
| Immigrants | Italy | 99.7 /100 | #53 | Exceptional 45.8% |
| Slovaks | 99.6 /100 | #54 | Exceptional 45.8% |
| Maltese | 99.6 /100 | #55 | Exceptional 45.8% |
| Immigrants | Netherlands | 99.6 /100 | #56 | Exceptional 45.9% |
| Immigrants | Turkey | 99.6 /100 | #57 | Exceptional 45.9% |
| Immigrants | Israel | 99.6 /100 | #58 | Exceptional 45.9% |
| Iranians | 99.6 /100 | #59 | Exceptional 45.9% |
| Immigrants | Europe | 99.6 /100 | #60 | Exceptional 45.9% |
| Immigrants | Argentina | 99.6 /100 | #61 | Exceptional 45.9% |
| Burmese | 99.5 /100 | #62 | Exceptional 45.9% |
| Immigrants | Norway | 99.5 /100 | #63 | Exceptional 45.9% |
| Immigrants | North Macedonia | 99.5 /100 | #64 | Exceptional 45.9% |
| Austrians | 99.5 /100 | #65 | Exceptional 46.0% |