Immigrants from Moldova vs Potawatomi Disability Age 65 to 74
COMPARE
Immigrants from Moldova
Potawatomi
Disability Age 65 to 74
Disability Age 65 to 74 Comparison
Immigrants from Moldova
Potawatomi
22.7%
DISABILITY AGE 65 TO 74
87.3/ 100
METRIC RATING
138th/ 347
METRIC RANK
27.0%
DISABILITY AGE 65 TO 74
0.0/ 100
METRIC RATING
299th/ 347
METRIC RANK
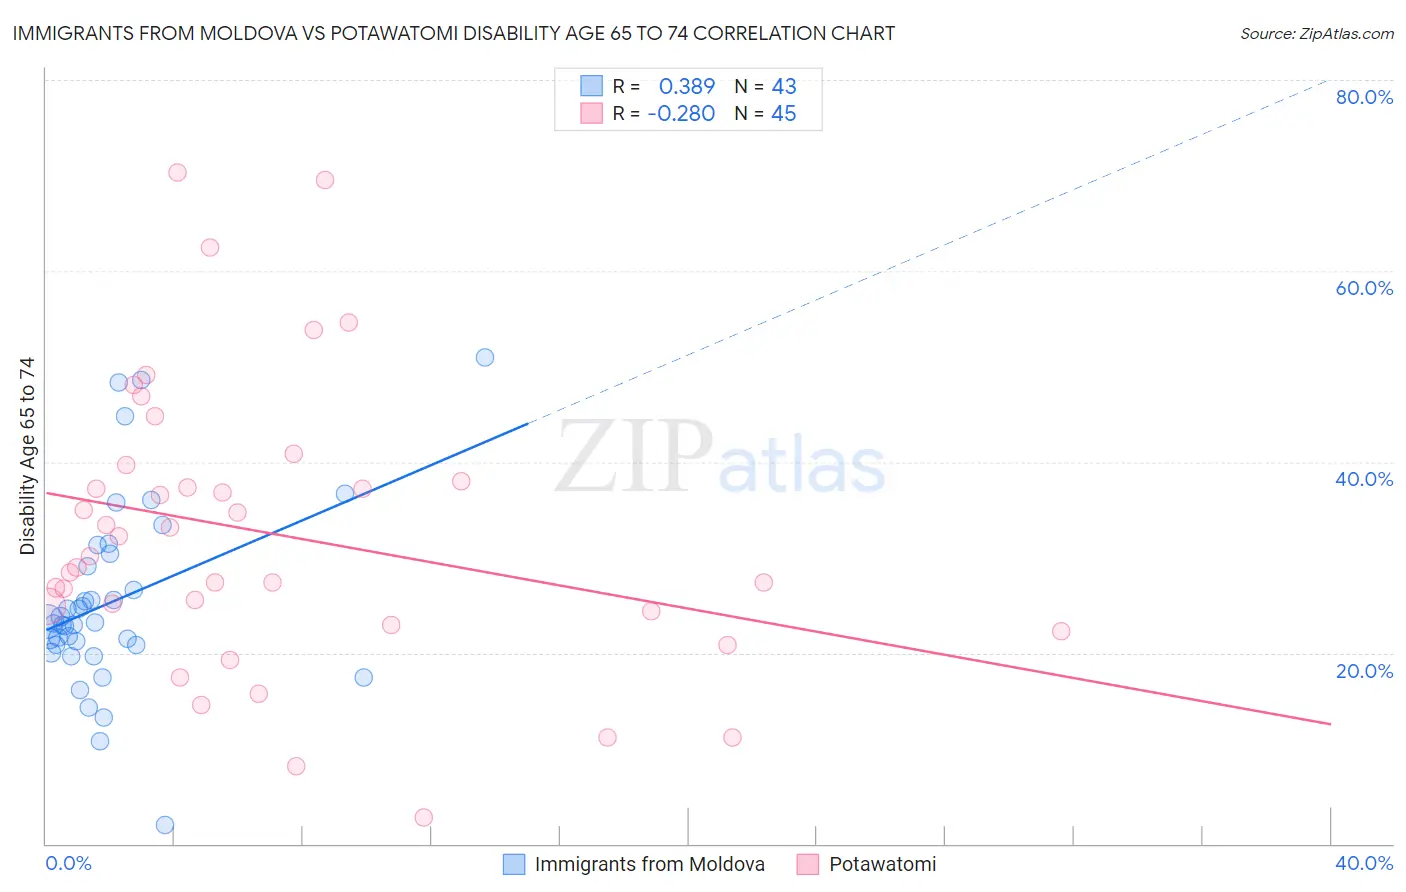
Immigrants from Moldova vs Potawatomi Disability Age 65 to 74 Correlation Chart
The statistical analysis conducted on geographies consisting of 124,298,636 people shows a mild positive correlation between the proportion of Immigrants from Moldova and percentage of population with a disability between the ages 65 and 75 in the United States with a correlation coefficient (R) of 0.389 and weighted average of 22.7%. Similarly, the statistical analysis conducted on geographies consisting of 117,710,706 people shows a weak negative correlation between the proportion of Potawatomi and percentage of population with a disability between the ages 65 and 75 in the United States with a correlation coefficient (R) of -0.280 and weighted average of 27.0%, a difference of 19.1%.
Disability Age 65 to 74 Correlation Summary
| Measurement | Immigrants from Moldova | Potawatomi |
| Minimum | 2.0% | 2.7% |
| Maximum | 50.9% | 70.4% |
| Range | 49.0% | 67.7% |
| Mean | 25.5% | 32.5% |
| Median | 23.1% | 30.1% |
| Interquartile 25% (IQ1) | 20.8% | 23.6% |
| Interquartile 75% (IQ3) | 30.4% | 38.9% |
| Interquartile Range (IQR) | 9.6% | 15.2% |
| Standard Deviation (Sample) | 9.9% | 15.0% |
| Standard Deviation (Population) | 9.8% | 14.9% |
Similar Demographics by Disability Age 65 to 74
Demographics Similar to Immigrants from Moldova by Disability Age 65 to 74
In terms of disability age 65 to 74, the demographic groups most similar to Immigrants from Moldova are Taiwanese (22.7%, a difference of 0.050%), Ethiopian (22.7%, a difference of 0.090%), Immigrants from Ukraine (22.6%, a difference of 0.15%), Afghan (22.6%, a difference of 0.19%), and Immigrants from Syria (22.7%, a difference of 0.19%).
| Demographics | Rating | Rank | Disability Age 65 to 74 |
| Immigrants | Nepal | 89.4 /100 | #131 | Excellent 22.6% |
| Costa Ricans | 89.2 /100 | #132 | Excellent 22.6% |
| Northern Europeans | 88.9 /100 | #133 | Excellent 22.6% |
| Afghans | 88.6 /100 | #134 | Excellent 22.6% |
| Immigrants | Ukraine | 88.4 /100 | #135 | Excellent 22.6% |
| Ethiopians | 87.9 /100 | #136 | Excellent 22.7% |
| Taiwanese | 87.6 /100 | #137 | Excellent 22.7% |
| Immigrants | Moldova | 87.3 /100 | #138 | Excellent 22.7% |
| Immigrants | Syria | 85.8 /100 | #139 | Excellent 22.7% |
| Ugandans | 85.4 /100 | #140 | Excellent 22.7% |
| Belgians | 85.3 /100 | #141 | Excellent 22.7% |
| Immigrants | Ethiopia | 85.3 /100 | #142 | Excellent 22.7% |
| Arabs | 84.8 /100 | #143 | Excellent 22.8% |
| Danes | 84.4 /100 | #144 | Excellent 22.8% |
| Immigrants | Uganda | 84.0 /100 | #145 | Excellent 22.8% |
Demographics Similar to Potawatomi by Disability Age 65 to 74
In terms of disability age 65 to 74, the demographic groups most similar to Potawatomi are Immigrants from Yemen (27.0%, a difference of 0.030%), Immigrants from Dominican Republic (27.0%, a difference of 0.030%), Fijian (27.0%, a difference of 0.050%), Immigrants from Mexico (27.1%, a difference of 0.35%), and Central American Indian (27.1%, a difference of 0.36%).
| Demographics | Rating | Rank | Disability Age 65 to 74 |
| Blackfeet | 0.0 /100 | #292 | Tragic 26.6% |
| Immigrants | Central America | 0.0 /100 | #293 | Tragic 26.6% |
| Dominicans | 0.0 /100 | #294 | Tragic 26.7% |
| Hispanics or Latinos | 0.0 /100 | #295 | Tragic 26.7% |
| Bangladeshis | 0.0 /100 | #296 | Tragic 26.8% |
| Fijians | 0.0 /100 | #297 | Tragic 27.0% |
| Immigrants | Yemen | 0.0 /100 | #298 | Tragic 27.0% |
| Potawatomi | 0.0 /100 | #299 | Tragic 27.0% |
| Immigrants | Dominican Republic | 0.0 /100 | #300 | Tragic 27.0% |
| Immigrants | Mexico | 0.0 /100 | #301 | Tragic 27.1% |
| Central American Indians | 0.0 /100 | #302 | Tragic 27.1% |
| Tlingit-Haida | 0.0 /100 | #303 | Tragic 27.1% |
| Puget Sound Salish | 0.0 /100 | #304 | Tragic 27.2% |
| Mexicans | 0.0 /100 | #305 | Tragic 27.2% |
| Blacks/African Americans | 0.0 /100 | #306 | Tragic 27.3% |