Somali vs Israeli Vision Disability
COMPARE
Somali
Israeli
Vision Disability
Vision Disability Comparison
Somalis
Israelis
2.0%
VISION DISABILITY
99.2/ 100
METRIC RATING
57th/ 347
METRIC RANK
2.0%
VISION DISABILITY
99.6/ 100
METRIC RATING
48th/ 347
METRIC RANK
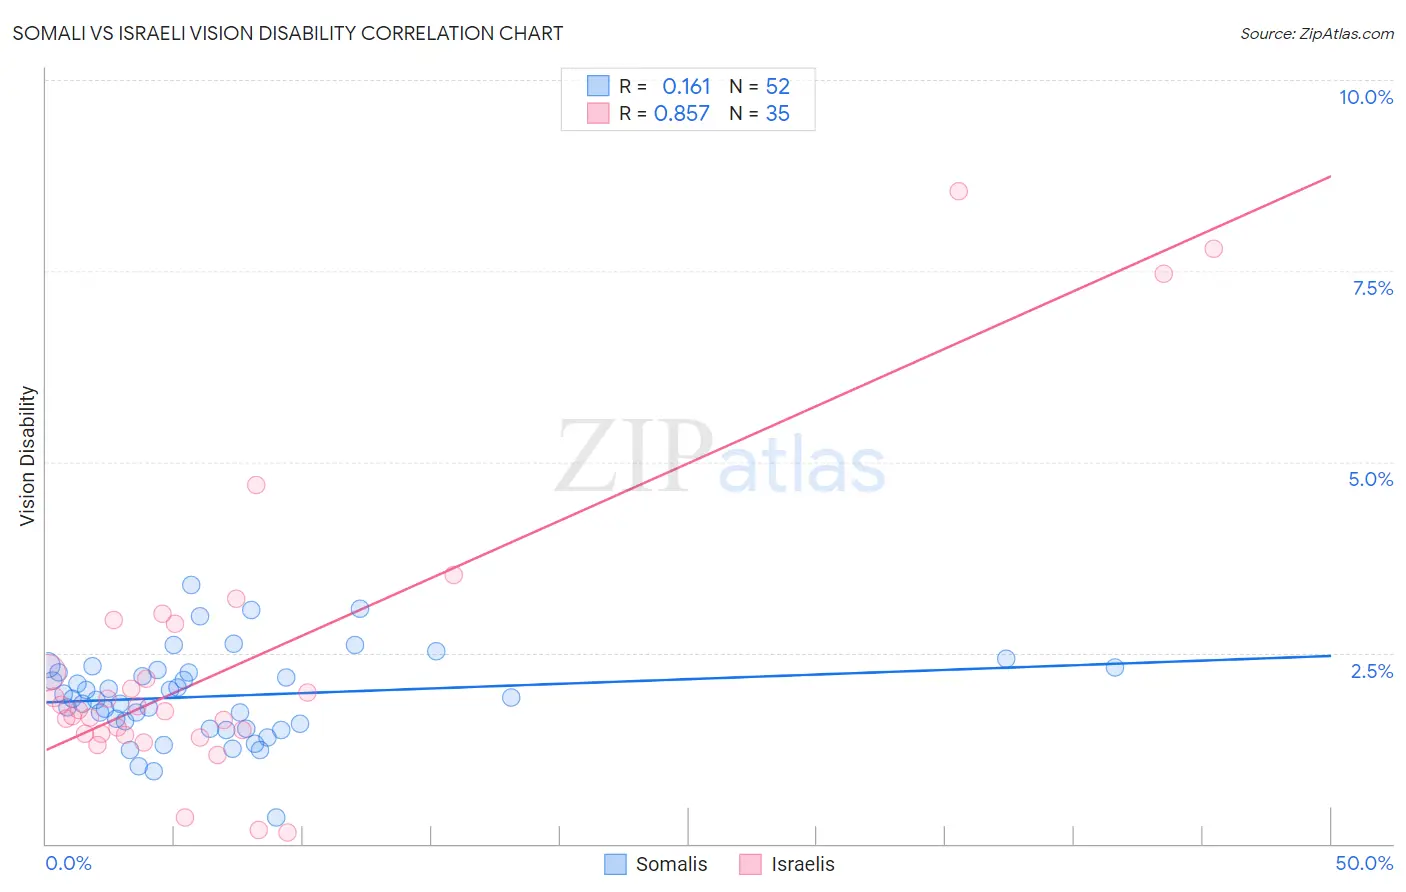
Somali vs Israeli Vision Disability Correlation Chart
The statistical analysis conducted on geographies consisting of 99,264,123 people shows a poor positive correlation between the proportion of Somalis and percentage of population with vision disability in the United States with a correlation coefficient (R) of 0.161 and weighted average of 2.0%. Similarly, the statistical analysis conducted on geographies consisting of 211,077,295 people shows a very strong positive correlation between the proportion of Israelis and percentage of population with vision disability in the United States with a correlation coefficient (R) of 0.857 and weighted average of 2.0%, a difference of 0.93%.
Vision Disability Correlation Summary
| Measurement | Somali | Israeli |
| Minimum | 0.35% | 0.15% |
| Maximum | 3.4% | 8.5% |
| Range | 3.0% | 8.4% |
| Mean | 1.9% | 2.4% |
| Median | 1.9% | 1.8% |
| Interquartile 25% (IQ1) | 1.5% | 1.4% |
| Interquartile 75% (IQ3) | 2.3% | 2.9% |
| Interquartile Range (IQR) | 0.72% | 1.4% |
| Standard Deviation (Sample) | 0.58% | 1.9% |
| Standard Deviation (Population) | 0.57% | 1.9% |
Demographics Similar to Somalis and Israelis by Vision Disability
In terms of vision disability, the demographic groups most similar to Somalis are Jordanian (2.0%, a difference of 0.020%), Immigrants from Saudi Arabia (2.0%, a difference of 0.070%), Laotian (2.0%, a difference of 0.19%), Argentinean (2.0%, a difference of 0.21%), and Macedonian (2.0%, a difference of 0.24%). Similarly, the demographic groups most similar to Israelis are Latvian (2.0%, a difference of 0.070%), Afghan (2.0%, a difference of 0.13%), Tongan (2.0%, a difference of 0.22%), Immigrants from Bulgaria (2.0%, a difference of 0.46%), and Immigrants from Sweden (2.0%, a difference of 0.48%).
| Demographics | Rating | Rank | Vision Disability |
| Immigrants | Ethiopia | 99.7 /100 | #42 | Exceptional 2.0% |
| Eastern Europeans | 99.7 /100 | #43 | Exceptional 2.0% |
| Immigrants | Indonesia | 99.7 /100 | #44 | Exceptional 2.0% |
| Ethiopians | 99.7 /100 | #45 | Exceptional 2.0% |
| Immigrants | Sweden | 99.7 /100 | #46 | Exceptional 2.0% |
| Immigrants | Bulgaria | 99.7 /100 | #47 | Exceptional 2.0% |
| Israelis | 99.6 /100 | #48 | Exceptional 2.0% |
| Latvians | 99.5 /100 | #49 | Exceptional 2.0% |
| Afghans | 99.5 /100 | #50 | Exceptional 2.0% |
| Tongans | 99.5 /100 | #51 | Exceptional 2.0% |
| Immigrants | Serbia | 99.4 /100 | #52 | Exceptional 2.0% |
| Immigrants | Belarus | 99.3 /100 | #53 | Exceptional 2.0% |
| Macedonians | 99.3 /100 | #54 | Exceptional 2.0% |
| Laotians | 99.3 /100 | #55 | Exceptional 2.0% |
| Jordanians | 99.2 /100 | #56 | Exceptional 2.0% |
| Somalis | 99.2 /100 | #57 | Exceptional 2.0% |
| Immigrants | Saudi Arabia | 99.2 /100 | #58 | Exceptional 2.0% |
| Argentineans | 99.1 /100 | #59 | Exceptional 2.0% |
| Immigrants | Romania | 99.1 /100 | #60 | Exceptional 2.0% |
| Immigrants | Belgium | 99.1 /100 | #61 | Exceptional 2.0% |
| Immigrants | Russia | 99.1 /100 | #62 | Exceptional 2.0% |