Immigrants from Somalia vs Colville Female Disability
COMPARE
Immigrants from Somalia
Colville
Female Disability
Female Disability Comparison
Immigrants from Somalia
Colville
12.5%
FEMALE DISABILITY
5.9/ 100
METRIC RATING
232nd/ 347
METRIC RANK
15.1%
FEMALE DISABILITY
0.0/ 100
METRIC RATING
339th/ 347
METRIC RANK
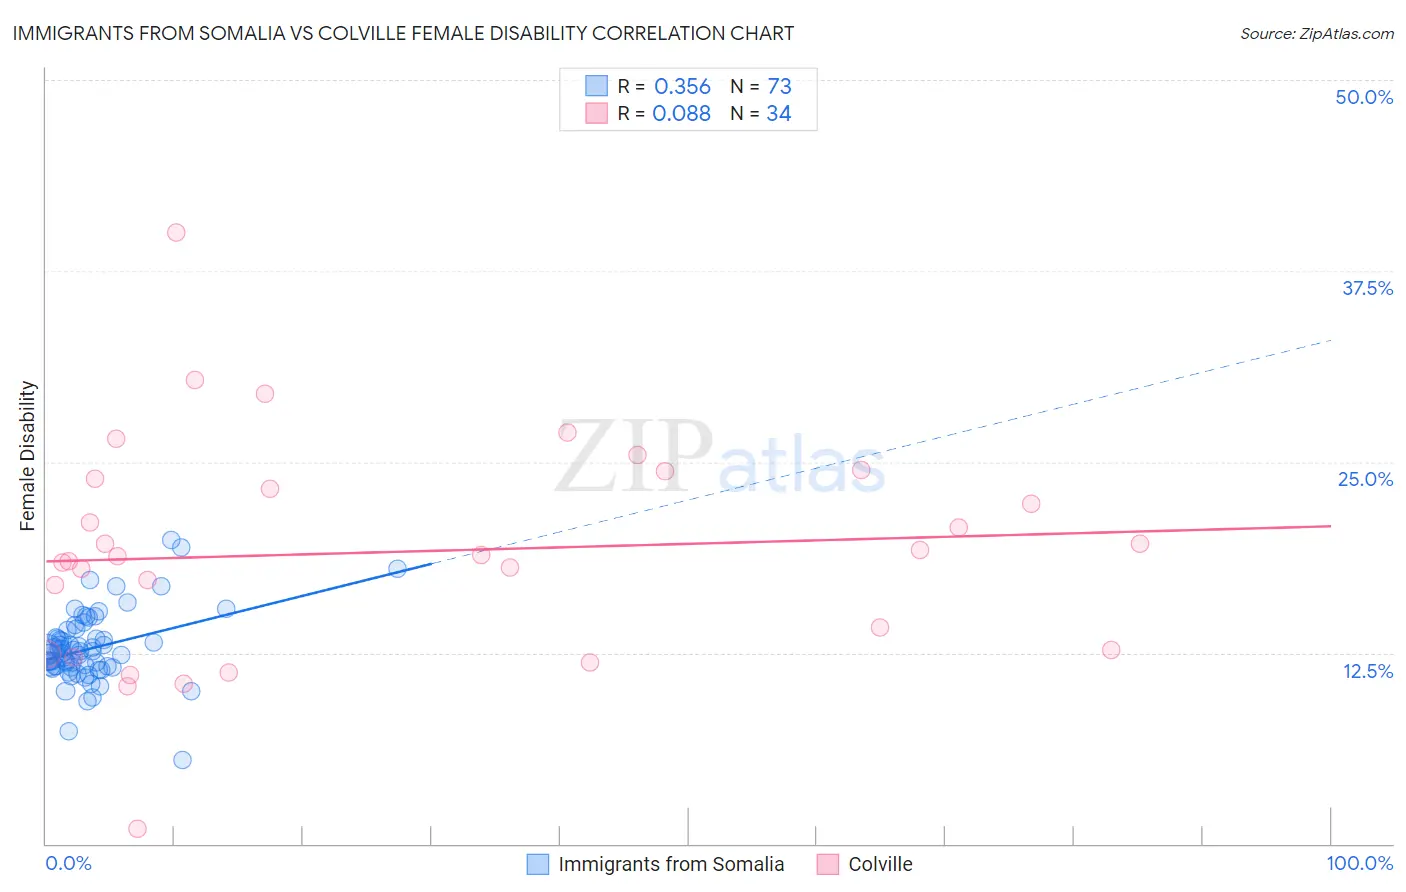
Immigrants from Somalia vs Colville Female Disability Correlation Chart
The statistical analysis conducted on geographies consisting of 92,095,400 people shows a mild positive correlation between the proportion of Immigrants from Somalia and percentage of females with a disability in the United States with a correlation coefficient (R) of 0.356 and weighted average of 12.5%. Similarly, the statistical analysis conducted on geographies consisting of 34,687,480 people shows a slight positive correlation between the proportion of Colville and percentage of females with a disability in the United States with a correlation coefficient (R) of 0.088 and weighted average of 15.1%, a difference of 20.4%.
Female Disability Correlation Summary
| Measurement | Immigrants from Somalia | Colville |
| Minimum | 5.5% | 0.95% |
| Maximum | 19.9% | 40.0% |
| Range | 14.4% | 39.1% |
| Mean | 12.8% | 19.1% |
| Median | 12.5% | 18.9% |
| Interquartile 25% (IQ1) | 11.6% | 12.7% |
| Interquartile 75% (IQ3) | 13.8% | 23.9% |
| Interquartile Range (IQR) | 2.2% | 11.3% |
| Standard Deviation (Sample) | 2.4% | 7.3% |
| Standard Deviation (Population) | 2.3% | 7.2% |
Similar Demographics by Female Disability
Demographics Similar to Immigrants from Somalia by Female Disability
In terms of female disability, the demographic groups most similar to Immigrants from Somalia are Belgian (12.5%, a difference of 0.090%), Immigrants from Iraq (12.5%, a difference of 0.10%), Scandinavian (12.5%, a difference of 0.11%), Immigrants from Belize (12.5%, a difference of 0.16%), and Malaysian (12.5%, a difference of 0.17%).
| Demographics | Rating | Rank | Female Disability |
| Poles | 8.4 /100 | #225 | Tragic 12.5% |
| Hispanics or Latinos | 8.0 /100 | #226 | Tragic 12.5% |
| Assyrians/Chaldeans/Syriacs | 8.0 /100 | #227 | Tragic 12.5% |
| Immigrants | Cambodia | 7.8 /100 | #228 | Tragic 12.5% |
| Hungarians | 7.2 /100 | #229 | Tragic 12.5% |
| Immigrants | Belize | 7.0 /100 | #230 | Tragic 12.5% |
| Belgians | 6.5 /100 | #231 | Tragic 12.5% |
| Immigrants | Somalia | 5.9 /100 | #232 | Tragic 12.5% |
| Immigrants | Iraq | 5.3 /100 | #233 | Tragic 12.5% |
| Scandinavians | 5.3 /100 | #234 | Tragic 12.5% |
| Malaysians | 5.0 /100 | #235 | Tragic 12.5% |
| Immigrants | West Indies | 4.4 /100 | #236 | Tragic 12.6% |
| Slavs | 3.8 /100 | #237 | Tragic 12.6% |
| Yugoslavians | 3.7 /100 | #238 | Tragic 12.6% |
| Barbadians | 3.6 /100 | #239 | Tragic 12.6% |
Demographics Similar to Colville by Female Disability
In terms of female disability, the demographic groups most similar to Colville are Dutch West Indian (15.0%, a difference of 0.40%), Tohono O'odham (15.0%, a difference of 0.55%), Seminole (15.0%, a difference of 0.67%), Chickasaw (15.2%, a difference of 0.95%), and Cajun (14.9%, a difference of 1.3%).
| Demographics | Rating | Rank | Female Disability |
| Pima | 0.0 /100 | #332 | Tragic 14.8% |
| Immigrants | Azores | 0.0 /100 | #333 | Tragic 14.9% |
| Cherokee | 0.0 /100 | #334 | Tragic 14.9% |
| Cajuns | 0.0 /100 | #335 | Tragic 14.9% |
| Seminole | 0.0 /100 | #336 | Tragic 15.0% |
| Tohono O'odham | 0.0 /100 | #337 | Tragic 15.0% |
| Dutch West Indians | 0.0 /100 | #338 | Tragic 15.0% |
| Colville | 0.0 /100 | #339 | Tragic 15.1% |
| Chickasaw | 0.0 /100 | #340 | Tragic 15.2% |
| Choctaw | 0.0 /100 | #341 | Tragic 15.4% |
| Creek | 0.0 /100 | #342 | Tragic 15.7% |
| Lumbee | 0.0 /100 | #343 | Tragic 15.8% |
| Kiowa | 0.0 /100 | #344 | Tragic 15.8% |
| Puerto Ricans | 0.0 /100 | #345 | Tragic 16.6% |
| Tsimshian | 0.0 /100 | #346 | Tragic 16.8% |