Bangladeshi vs Yugoslavian Disability Age 18 to 34
COMPARE
Bangladeshi
Yugoslavian
Disability Age 18 to 34
Disability Age 18 to 34 Comparison
Bangladeshis
Yugoslavians
7.4%
DISABILITY AGE 18 TO 34
0.1/ 100
METRIC RATING
267th/ 347
METRIC RANK
7.2%
DISABILITY AGE 18 TO 34
0.8/ 100
METRIC RATING
247th/ 347
METRIC RANK
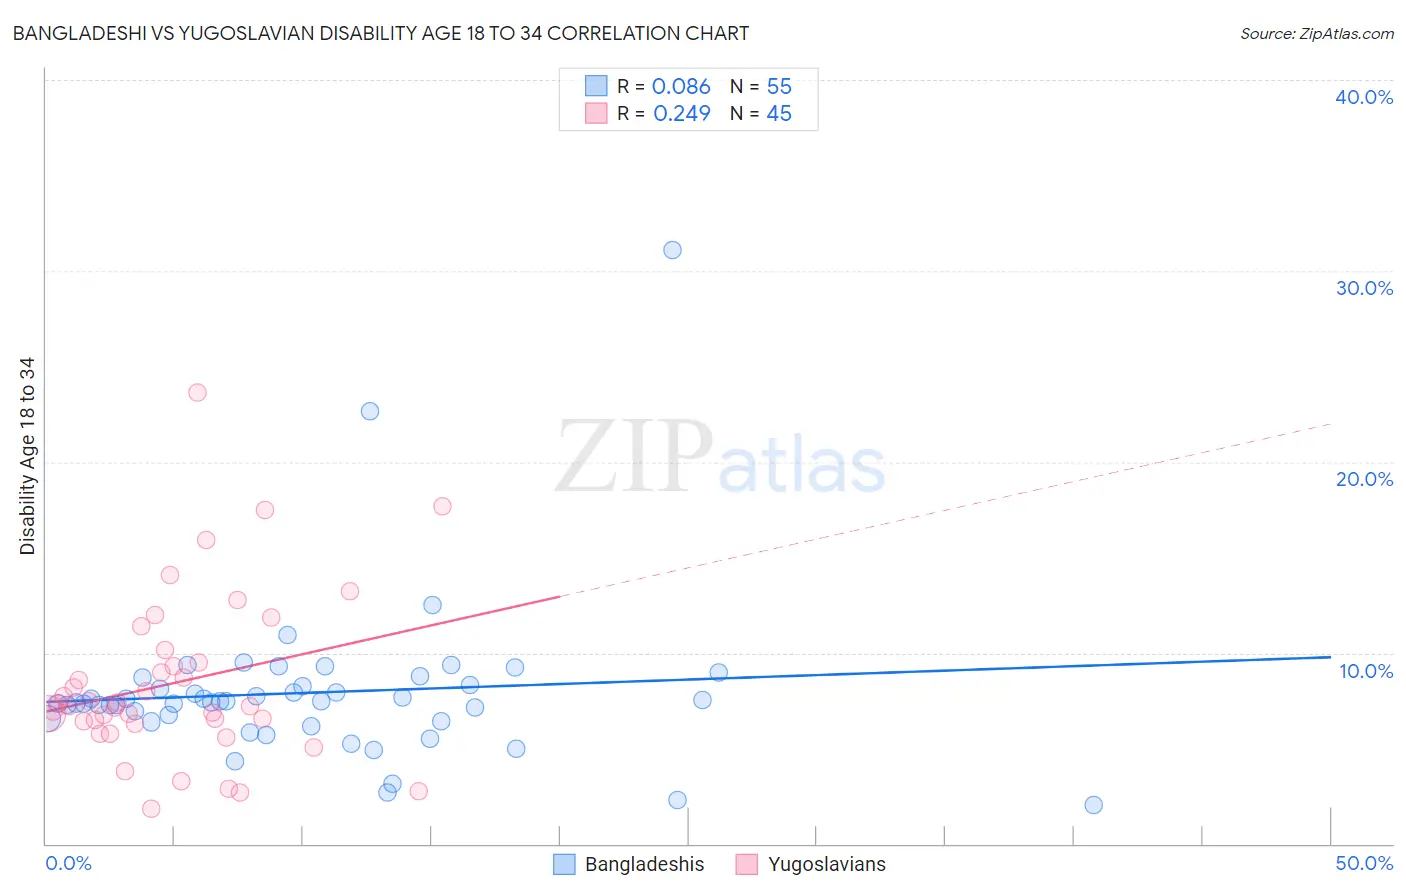
Bangladeshi vs Yugoslavian Disability Age 18 to 34 Correlation Chart
The statistical analysis conducted on geographies consisting of 141,298,809 people shows a slight positive correlation between the proportion of Bangladeshis and percentage of population with a disability between the ages 18 and 35 in the United States with a correlation coefficient (R) of 0.086 and weighted average of 7.4%. Similarly, the statistical analysis conducted on geographies consisting of 285,257,895 people shows a weak positive correlation between the proportion of Yugoslavians and percentage of population with a disability between the ages 18 and 35 in the United States with a correlation coefficient (R) of 0.249 and weighted average of 7.2%, a difference of 2.9%.
Disability Age 18 to 34 Correlation Summary
| Measurement | Bangladeshi | Yugoslavian |
| Minimum | 2.0% | 1.9% |
| Maximum | 31.1% | 23.6% |
| Range | 29.1% | 21.8% |
| Mean | 7.9% | 8.4% |
| Median | 7.5% | 7.2% |
| Interquartile 25% (IQ1) | 6.4% | 6.3% |
| Interquartile 75% (IQ3) | 8.3% | 9.8% |
| Interquartile Range (IQR) | 1.9% | 3.5% |
| Standard Deviation (Sample) | 4.3% | 4.3% |
| Standard Deviation (Population) | 4.2% | 4.3% |
Demographics Similar to Bangladeshis and Yugoslavians by Disability Age 18 to 34
In terms of disability age 18 to 34, the demographic groups most similar to Bangladeshis are German Russian (7.4%, a difference of 0.060%), Slovene (7.3%, a difference of 0.23%), Bermudan (7.3%, a difference of 0.25%), British (7.3%, a difference of 0.51%), and Canadian (7.3%, a difference of 0.80%). Similarly, the demographic groups most similar to Yugoslavians are Guamanian/Chamorro (7.2%, a difference of 0.040%), Malaysian (7.2%, a difference of 0.13%), Fijian (7.2%, a difference of 0.43%), Spaniard (7.2%, a difference of 0.44%), and Polish (7.2%, a difference of 0.46%).
| Demographics | Rating | Rank | Disability Age 18 to 34 |
| Yugoslavians | 0.8 /100 | #247 | Tragic 7.2% |
| Guamanians/Chamorros | 0.8 /100 | #248 | Tragic 7.2% |
| Malaysians | 0.7 /100 | #249 | Tragic 7.2% |
| Fijians | 0.6 /100 | #250 | Tragic 7.2% |
| Spaniards | 0.6 /100 | #251 | Tragic 7.2% |
| Poles | 0.6 /100 | #252 | Tragic 7.2% |
| Croatians | 0.5 /100 | #253 | Tragic 7.2% |
| Indonesians | 0.4 /100 | #254 | Tragic 7.2% |
| Immigrants | Germany | 0.4 /100 | #255 | Tragic 7.2% |
| Immigrants | Laos | 0.4 /100 | #256 | Tragic 7.2% |
| Czechs | 0.3 /100 | #257 | Tragic 7.2% |
| Immigrants | Micronesia | 0.3 /100 | #258 | Tragic 7.3% |
| Somalis | 0.2 /100 | #259 | Tragic 7.3% |
| Tohono O'odham | 0.2 /100 | #260 | Tragic 7.3% |
| Northern Europeans | 0.2 /100 | #261 | Tragic 7.3% |
| Canadians | 0.2 /100 | #262 | Tragic 7.3% |
| British | 0.2 /100 | #263 | Tragic 7.3% |
| Bermudans | 0.1 /100 | #264 | Tragic 7.3% |
| Slovenes | 0.1 /100 | #265 | Tragic 7.3% |
| German Russians | 0.1 /100 | #266 | Tragic 7.4% |
| Bangladeshis | 0.1 /100 | #267 | Tragic 7.4% |