Immigrants from South Africa vs Yugoslavian Disability Age 18 to 34
COMPARE
Immigrants from South Africa
Yugoslavian
Disability Age 18 to 34
Disability Age 18 to 34 Comparison
Immigrants from South Africa
Yugoslavians
6.4%
DISABILITY AGE 18 TO 34
83.7/ 100
METRIC RATING
147th/ 347
METRIC RANK
7.2%
DISABILITY AGE 18 TO 34
0.8/ 100
METRIC RATING
247th/ 347
METRIC RANK
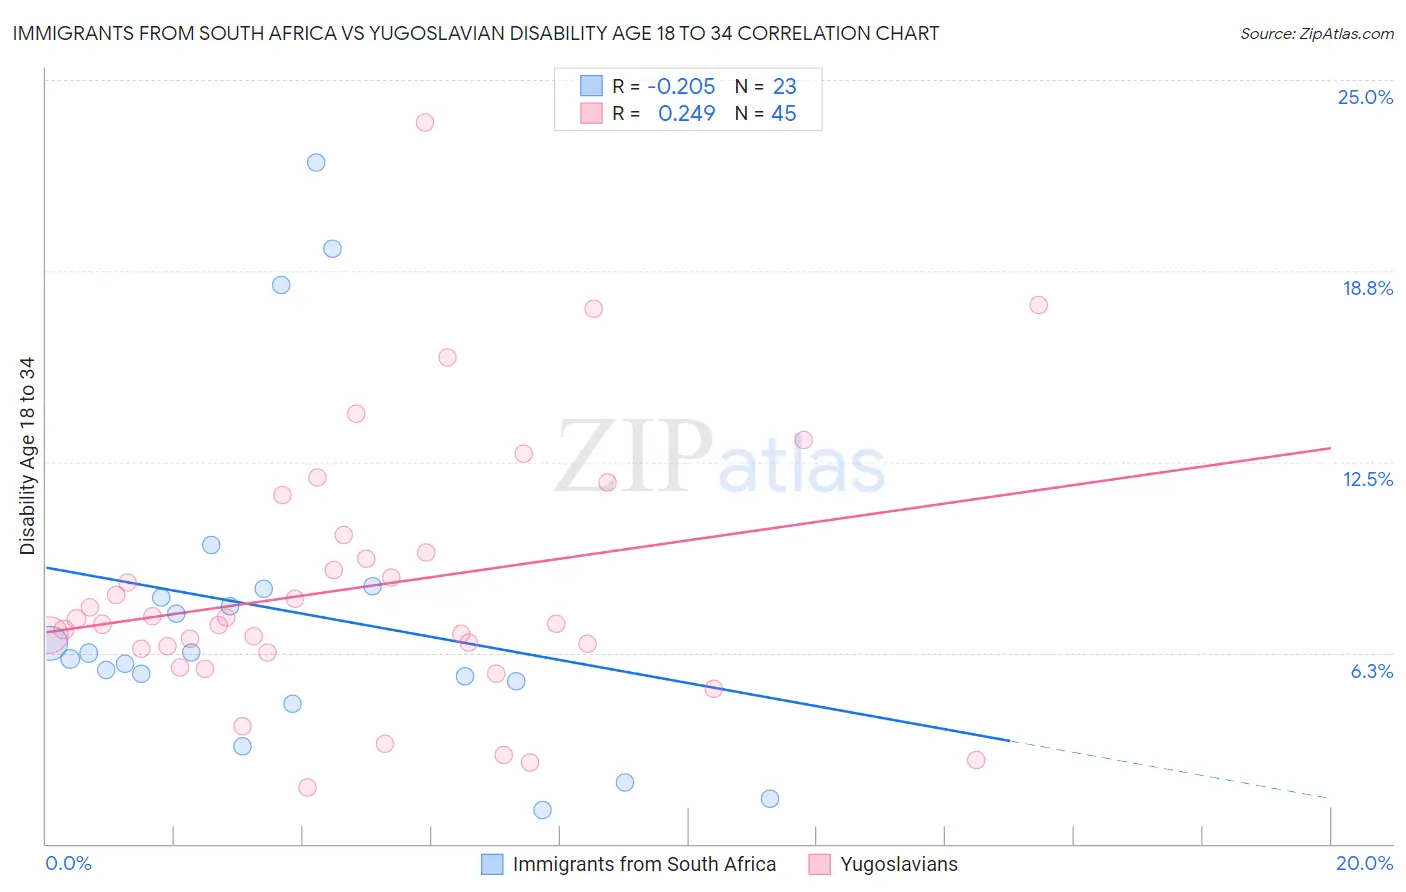
Immigrants from South Africa vs Yugoslavian Disability Age 18 to 34 Correlation Chart
The statistical analysis conducted on geographies consisting of 232,965,989 people shows a weak negative correlation between the proportion of Immigrants from South Africa and percentage of population with a disability between the ages 18 and 35 in the United States with a correlation coefficient (R) of -0.205 and weighted average of 6.4%. Similarly, the statistical analysis conducted on geographies consisting of 285,257,895 people shows a weak positive correlation between the proportion of Yugoslavians and percentage of population with a disability between the ages 18 and 35 in the United States with a correlation coefficient (R) of 0.249 and weighted average of 7.2%, a difference of 11.6%.
Disability Age 18 to 34 Correlation Summary
| Measurement | Immigrants from South Africa | Yugoslavian |
| Minimum | 1.1% | 1.9% |
| Maximum | 22.3% | 23.6% |
| Range | 21.2% | 21.8% |
| Mean | 7.6% | 8.4% |
| Median | 6.2% | 7.2% |
| Interquartile 25% (IQ1) | 5.3% | 6.3% |
| Interquartile 75% (IQ3) | 8.4% | 9.8% |
| Interquartile Range (IQR) | 3.0% | 3.5% |
| Standard Deviation (Sample) | 5.4% | 4.3% |
| Standard Deviation (Population) | 5.3% | 4.3% |
Similar Demographics by Disability Age 18 to 34
Demographics Similar to Immigrants from South Africa by Disability Age 18 to 34
In terms of disability age 18 to 34, the demographic groups most similar to Immigrants from South Africa are Immigrants from Belgium (6.4%, a difference of 0.020%), Honduran (6.4%, a difference of 0.070%), Immigrants from Dominican Republic (6.4%, a difference of 0.12%), Belizean (6.4%, a difference of 0.16%), and Moroccan (6.4%, a difference of 0.21%).
| Demographics | Rating | Rank | Disability Age 18 to 34 |
| Immigrants | Fiji | 87.3 /100 | #140 | Excellent 6.4% |
| Jamaicans | 86.8 /100 | #141 | Excellent 6.4% |
| South American Indians | 86.5 /100 | #142 | Excellent 6.4% |
| Immigrants | Latvia | 86.4 /100 | #143 | Excellent 6.4% |
| Albanians | 85.3 /100 | #144 | Excellent 6.4% |
| Moroccans | 85.2 /100 | #145 | Excellent 6.4% |
| Belizeans | 84.9 /100 | #146 | Excellent 6.4% |
| Immigrants | South Africa | 83.7 /100 | #147 | Excellent 6.4% |
| Immigrants | Belgium | 83.5 /100 | #148 | Excellent 6.4% |
| Hondurans | 83.1 /100 | #149 | Excellent 6.4% |
| Immigrants | Dominican Republic | 82.7 /100 | #150 | Excellent 6.4% |
| Tongans | 81.9 /100 | #151 | Excellent 6.4% |
| Bulgarians | 78.3 /100 | #152 | Good 6.5% |
| Immigrants | Eritrea | 77.4 /100 | #153 | Good 6.5% |
| Immigrants | Central America | 76.8 /100 | #154 | Good 6.5% |
Demographics Similar to Yugoslavians by Disability Age 18 to 34
In terms of disability age 18 to 34, the demographic groups most similar to Yugoslavians are Guamanian/Chamorro (7.2%, a difference of 0.040%), Malaysian (7.2%, a difference of 0.13%), Immigrants from Liberia (7.1%, a difference of 0.15%), Hungarian (7.1%, a difference of 0.17%), and Immigrants from Zaire (7.1%, a difference of 0.27%).
| Demographics | Rating | Rank | Disability Age 18 to 34 |
| Arapaho | 1.1 /100 | #240 | Tragic 7.1% |
| Nepalese | 1.1 /100 | #241 | Tragic 7.1% |
| Immigrants | Congo | 1.1 /100 | #242 | Tragic 7.1% |
| Icelanders | 1.0 /100 | #243 | Tragic 7.1% |
| Immigrants | Zaire | 0.9 /100 | #244 | Tragic 7.1% |
| Hungarians | 0.9 /100 | #245 | Tragic 7.1% |
| Immigrants | Liberia | 0.8 /100 | #246 | Tragic 7.1% |
| Yugoslavians | 0.8 /100 | #247 | Tragic 7.2% |
| Guamanians/Chamorros | 0.8 /100 | #248 | Tragic 7.2% |
| Malaysians | 0.7 /100 | #249 | Tragic 7.2% |
| Fijians | 0.6 /100 | #250 | Tragic 7.2% |
| Spaniards | 0.6 /100 | #251 | Tragic 7.2% |
| Poles | 0.6 /100 | #252 | Tragic 7.2% |
| Croatians | 0.5 /100 | #253 | Tragic 7.2% |
| Indonesians | 0.4 /100 | #254 | Tragic 7.2% |