Honduran vs Central American Disability Age 65 to 74
COMPARE
Honduran
Central American
Disability Age 65 to 74
Disability Age 65 to 74 Comparison
Hondurans
Central Americans
25.8%
DISABILITY AGE 65 TO 74
0.1/ 100
METRIC RATING
275th/ 347
METRIC RANK
25.1%
DISABILITY AGE 65 TO 74
0.5/ 100
METRIC RATING
255th/ 347
METRIC RANK
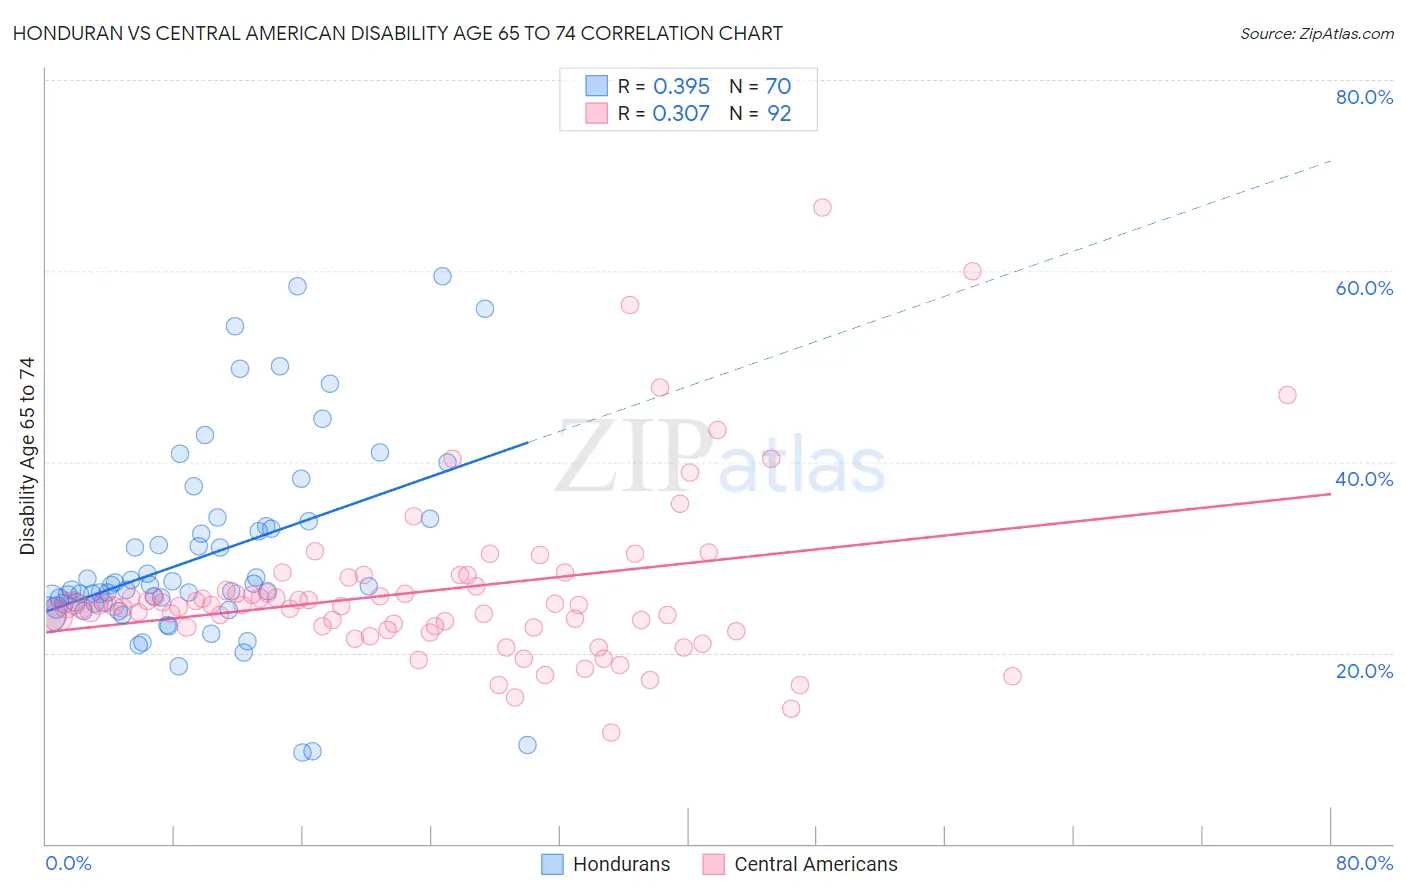
Honduran vs Central American Disability Age 65 to 74 Correlation Chart
The statistical analysis conducted on geographies consisting of 357,197,104 people shows a mild positive correlation between the proportion of Hondurans and percentage of population with a disability between the ages 65 and 75 in the United States with a correlation coefficient (R) of 0.395 and weighted average of 25.8%. Similarly, the statistical analysis conducted on geographies consisting of 503,060,028 people shows a mild positive correlation between the proportion of Central Americans and percentage of population with a disability between the ages 65 and 75 in the United States with a correlation coefficient (R) of 0.307 and weighted average of 25.1%, a difference of 2.7%.
Disability Age 65 to 74 Correlation Summary
| Measurement | Honduran | Central American |
| Minimum | 9.5% | 11.6% |
| Maximum | 59.5% | 66.7% |
| Range | 50.0% | 55.1% |
| Mean | 30.1% | 26.5% |
| Median | 26.8% | 25.0% |
| Interquartile 25% (IQ1) | 25.2% | 22.7% |
| Interquartile 75% (IQ3) | 33.2% | 26.8% |
| Interquartile Range (IQR) | 8.0% | 4.1% |
| Standard Deviation (Sample) | 10.4% | 8.9% |
| Standard Deviation (Population) | 10.3% | 8.9% |
Demographics Similar to Hondurans and Central Americans by Disability Age 65 to 74
In terms of disability age 65 to 74, the demographic groups most similar to Hondurans are American (25.8%, a difference of 0.010%), Japanese (25.7%, a difference of 0.34%), Immigrants from Dominica (25.7%, a difference of 0.47%), Immigrants from Liberia (25.7%, a difference of 0.48%), and Immigrants from Guatemala (25.7%, a difference of 0.50%). Similarly, the demographic groups most similar to Central Americans are Immigrants from Somalia (25.2%, a difference of 0.41%), Guamanian/Chamorro (25.3%, a difference of 0.59%), Marshallese (25.3%, a difference of 0.64%), Immigrants from Cambodia (25.3%, a difference of 0.74%), and Malaysian (25.4%, a difference of 1.1%).
| Demographics | Rating | Rank | Disability Age 65 to 74 |
| Central Americans | 0.5 /100 | #255 | Tragic 25.1% |
| Immigrants | Somalia | 0.4 /100 | #256 | Tragic 25.2% |
| Guamanians/Chamorros | 0.3 /100 | #257 | Tragic 25.3% |
| Marshallese | 0.3 /100 | #258 | Tragic 25.3% |
| Immigrants | Cambodia | 0.3 /100 | #259 | Tragic 25.3% |
| Malaysians | 0.2 /100 | #260 | Tragic 25.4% |
| Cape Verdeans | 0.2 /100 | #261 | Tragic 25.4% |
| Samoans | 0.2 /100 | #262 | Tragic 25.4% |
| Iroquois | 0.2 /100 | #263 | Tragic 25.4% |
| Hawaiians | 0.2 /100 | #264 | Tragic 25.5% |
| Guatemalans | 0.2 /100 | #265 | Tragic 25.5% |
| Immigrants | Latin America | 0.1 /100 | #266 | Tragic 25.6% |
| Ottawa | 0.1 /100 | #267 | Tragic 25.6% |
| Liberians | 0.1 /100 | #268 | Tragic 25.6% |
| Hmong | 0.1 /100 | #269 | Tragic 25.7% |
| Immigrants | Guatemala | 0.1 /100 | #270 | Tragic 25.7% |
| Immigrants | Liberia | 0.1 /100 | #271 | Tragic 25.7% |
| Immigrants | Dominica | 0.1 /100 | #272 | Tragic 25.7% |
| Japanese | 0.1 /100 | #273 | Tragic 25.7% |
| Americans | 0.1 /100 | #274 | Tragic 25.8% |
| Hondurans | 0.1 /100 | #275 | Tragic 25.8% |