Pennsylvania German vs Asian Cognitive Disability
COMPARE
Pennsylvania German
Asian
Cognitive Disability
Cognitive Disability Comparison
Pennsylvania Germans
Asians
16.6%
COGNITIVE DISABILITY
99.7/ 100
METRIC RATING
58th/ 347
METRIC RANK
16.7%
COGNITIVE DISABILITY
98.7/ 100
METRIC RATING
94th/ 347
METRIC RANK
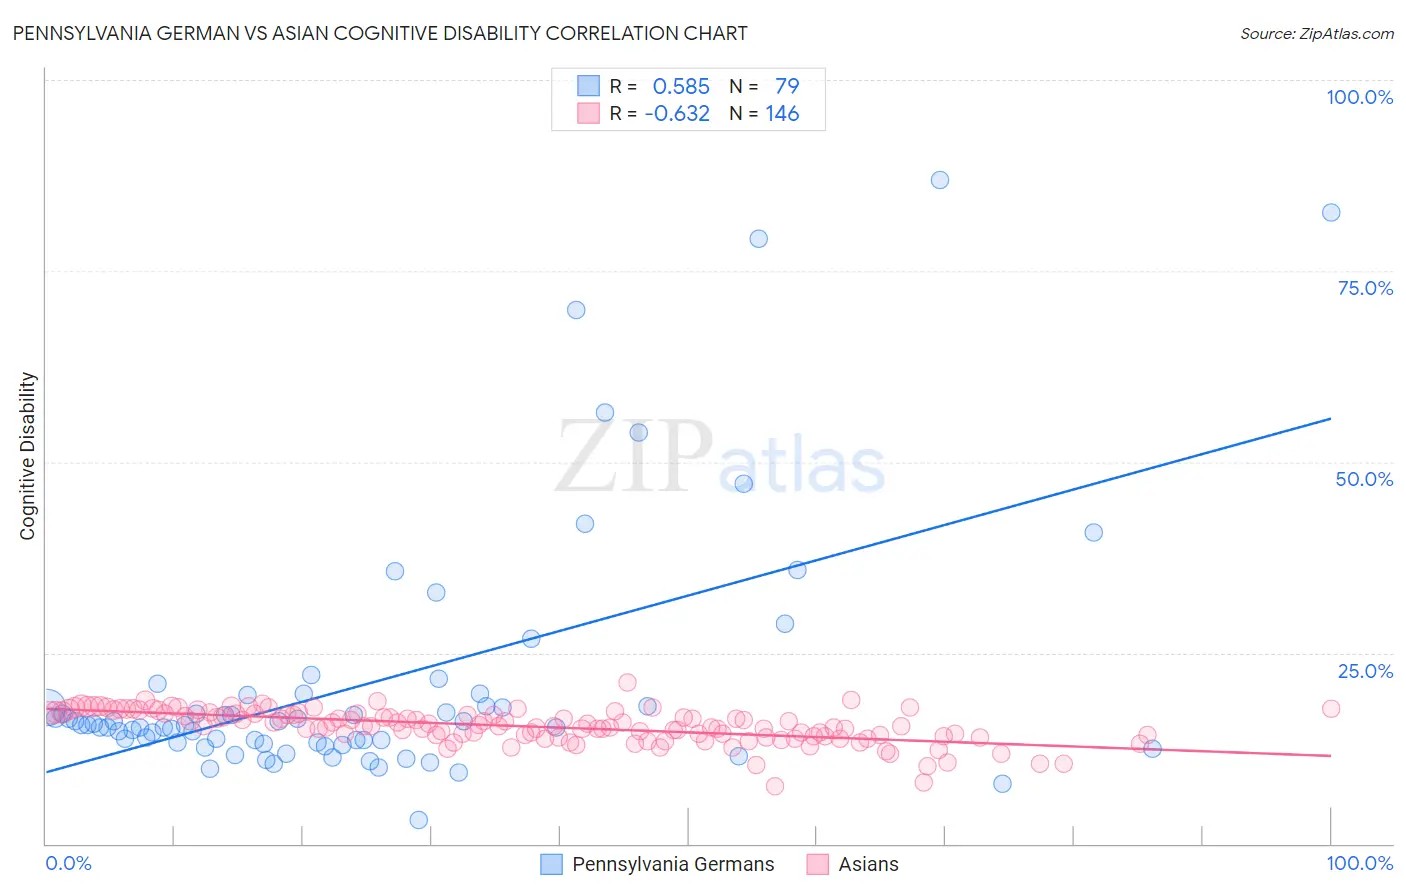
Pennsylvania German vs Asian Cognitive Disability Correlation Chart
The statistical analysis conducted on geographies consisting of 234,106,123 people shows a substantial positive correlation between the proportion of Pennsylvania Germans and percentage of population with cognitive disability in the United States with a correlation coefficient (R) of 0.585 and weighted average of 16.6%. Similarly, the statistical analysis conducted on geographies consisting of 550,791,869 people shows a significant negative correlation between the proportion of Asians and percentage of population with cognitive disability in the United States with a correlation coefficient (R) of -0.632 and weighted average of 16.7%, a difference of 1.0%.
Cognitive Disability Correlation Summary
| Measurement | Pennsylvania German | Asian |
| Minimum | 3.1% | 7.5% |
| Maximum | 87.0% | 21.2% |
| Range | 83.8% | 13.7% |
| Mean | 21.1% | 15.4% |
| Median | 15.5% | 15.4% |
| Interquartile 25% (IQ1) | 13.2% | 14.2% |
| Interquartile 75% (IQ3) | 19.5% | 17.1% |
| Interquartile Range (IQR) | 6.3% | 3.0% |
| Standard Deviation (Sample) | 16.7% | 2.2% |
| Standard Deviation (Population) | 16.6% | 2.2% |
Similar Demographics by Cognitive Disability
Demographics Similar to Pennsylvania Germans by Cognitive Disability
In terms of cognitive disability, the demographic groups most similar to Pennsylvania Germans are Immigrants from Peru (16.6%, a difference of 0.0%), Romanian (16.6%, a difference of 0.010%), Immigrants from England (16.6%, a difference of 0.070%), Austrian (16.6%, a difference of 0.080%), and Bhutanese (16.6%, a difference of 0.080%).
| Demographics | Rating | Rank | Cognitive Disability |
| Immigrants | Korea | 99.8 /100 | #51 | Exceptional 16.5% |
| Soviet Union | 99.8 /100 | #52 | Exceptional 16.5% |
| Swedes | 99.8 /100 | #53 | Exceptional 16.5% |
| Immigrants | Iran | 99.8 /100 | #54 | Exceptional 16.5% |
| Immigrants | Venezuela | 99.7 /100 | #55 | Exceptional 16.5% |
| Austrians | 99.7 /100 | #56 | Exceptional 16.6% |
| Bhutanese | 99.7 /100 | #57 | Exceptional 16.6% |
| Pennsylvania Germans | 99.7 /100 | #58 | Exceptional 16.6% |
| Immigrants | Peru | 99.7 /100 | #59 | Exceptional 16.6% |
| Romanians | 99.7 /100 | #60 | Exceptional 16.6% |
| Immigrants | England | 99.6 /100 | #61 | Exceptional 16.6% |
| Czechoslovakians | 99.6 /100 | #62 | Exceptional 16.6% |
| Argentineans | 99.6 /100 | #63 | Exceptional 16.6% |
| Venezuelans | 99.6 /100 | #64 | Exceptional 16.6% |
| Colombians | 99.6 /100 | #65 | Exceptional 16.6% |
Demographics Similar to Asians by Cognitive Disability
In terms of cognitive disability, the demographic groups most similar to Asians are Immigrants from Southern Europe (16.7%, a difference of 0.040%), Immigrants from South America (16.7%, a difference of 0.050%), Danish (16.7%, a difference of 0.060%), English (16.8%, a difference of 0.060%), and Immigrants from Egypt (16.7%, a difference of 0.070%).
| Demographics | Rating | Rank | Cognitive Disability |
| Native Hawaiians | 99.0 /100 | #87 | Exceptional 16.7% |
| Immigrants | Philippines | 99.0 /100 | #88 | Exceptional 16.7% |
| Immigrants | Egypt | 98.8 /100 | #89 | Exceptional 16.7% |
| South Americans | 98.8 /100 | #90 | Exceptional 16.7% |
| Danes | 98.8 /100 | #91 | Exceptional 16.7% |
| Immigrants | South America | 98.8 /100 | #92 | Exceptional 16.7% |
| Immigrants | Southern Europe | 98.7 /100 | #93 | Exceptional 16.7% |
| Asians | 98.7 /100 | #94 | Exceptional 16.7% |
| English | 98.6 /100 | #95 | Exceptional 16.8% |
| Finns | 98.5 /100 | #96 | Exceptional 16.8% |
| Dutch | 98.5 /100 | #97 | Exceptional 16.8% |
| Immigrants | Lebanon | 98.4 /100 | #98 | Exceptional 16.8% |
| Jordanians | 98.2 /100 | #99 | Exceptional 16.8% |
| Immigrants | Russia | 98.2 /100 | #100 | Exceptional 16.8% |
| Immigrants | Asia | 98.1 /100 | #101 | Exceptional 16.8% |