Immigrants from Caribbean vs Immigrants from Belize Unemployment Among Ages 60 to 64 years
COMPARE
Immigrants from Caribbean
Immigrants from Belize
Unemployment Among Ages 60 to 64 years
Unemployment Among Ages 60 to 64 years Comparison
Immigrants from Caribbean
Immigrants from Belize
5.2%
UNEMPLOYMENT AMONG AGES 60 TO 64 YEARS
0.0/ 100
METRIC RATING
277th/ 347
METRIC RANK
5.7%
UNEMPLOYMENT AMONG AGES 60 TO 64 YEARS
0.0/ 100
METRIC RATING
319th/ 347
METRIC RANK
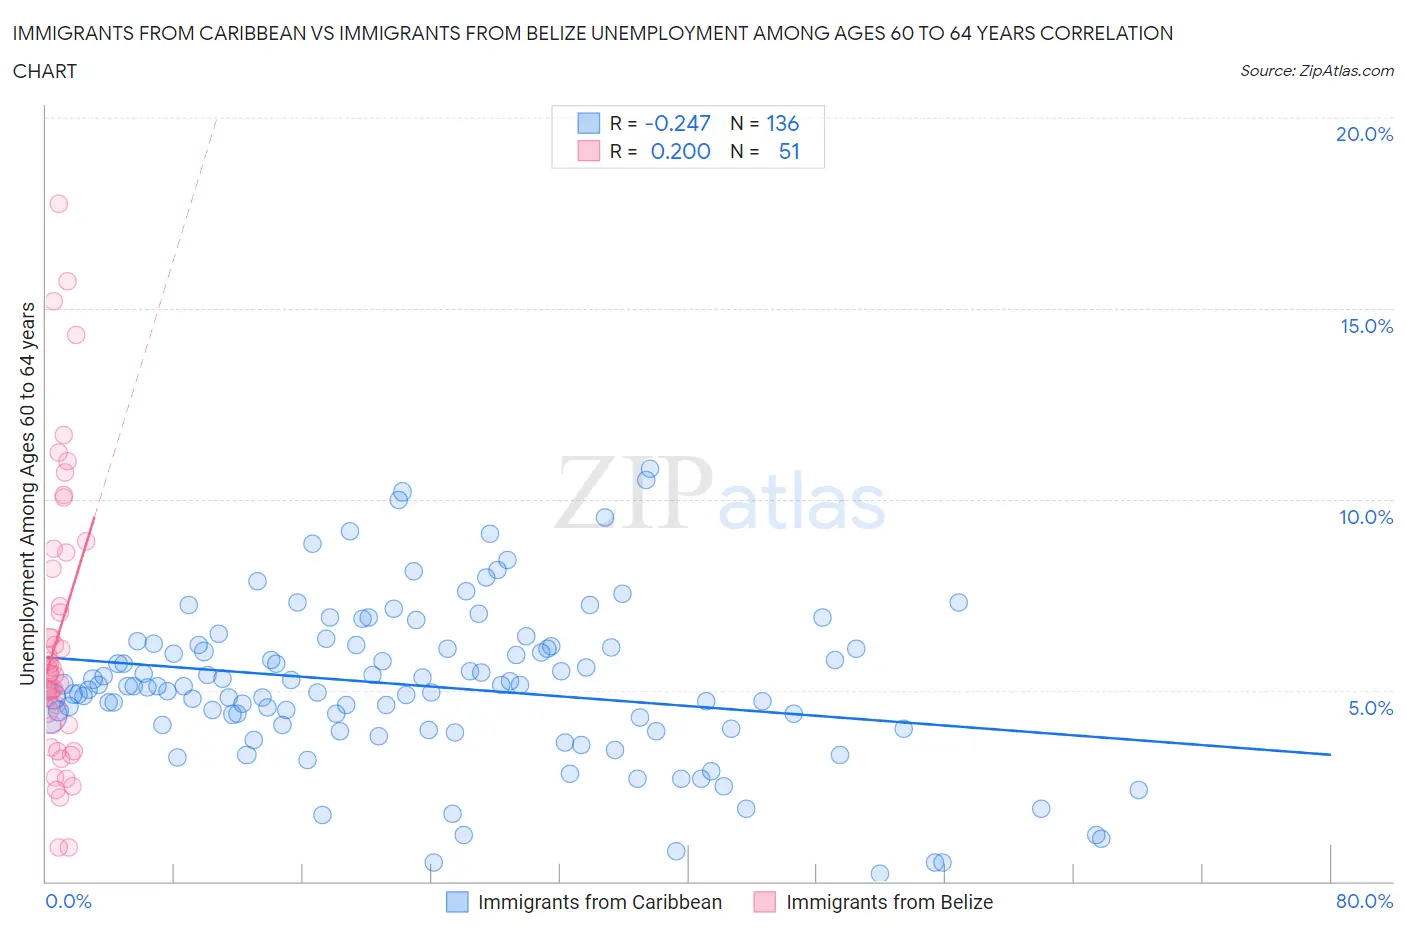
Immigrants from Caribbean vs Immigrants from Belize Unemployment Among Ages 60 to 64 years Correlation Chart
The statistical analysis conducted on geographies consisting of 400,660,483 people shows a weak negative correlation between the proportion of Immigrants from Caribbean and unemployment rate among population between the ages 60 and 64 in the United States with a correlation coefficient (R) of -0.247 and weighted average of 5.2%. Similarly, the statistical analysis conducted on geographies consisting of 126,159,740 people shows a weak positive correlation between the proportion of Immigrants from Belize and unemployment rate among population between the ages 60 and 64 in the United States with a correlation coefficient (R) of 0.200 and weighted average of 5.7%, a difference of 9.3%.
Unemployment Among Ages 60 to 64 years Correlation Summary
| Measurement | Immigrants from Caribbean | Immigrants from Belize |
| Minimum | 0.20% | 0.90% |
| Maximum | 10.8% | 17.8% |
| Range | 10.6% | 16.9% |
| Mean | 5.1% | 6.5% |
| Median | 5.1% | 5.4% |
| Interquartile 25% (IQ1) | 4.0% | 4.1% |
| Interquartile 75% (IQ3) | 6.1% | 8.6% |
| Interquartile Range (IQR) | 2.1% | 4.5% |
| Standard Deviation (Sample) | 2.1% | 3.8% |
| Standard Deviation (Population) | 2.1% | 3.7% |
Similar Demographics by Unemployment Among Ages 60 to 64 years
Demographics Similar to Immigrants from Caribbean by Unemployment Among Ages 60 to 64 years
In terms of unemployment among ages 60 to 64 years, the demographic groups most similar to Immigrants from Caribbean are Central American (5.2%, a difference of 0.27%), Guatemalan (5.2%, a difference of 0.37%), Immigrants from Hong Kong (5.2%, a difference of 0.43%), Hopi (5.2%, a difference of 0.57%), and Nepalese (5.2%, a difference of 0.57%).
| Demographics | Rating | Rank | Unemployment Among Ages 60 to 64 years |
| Immigrants | Iran | 0.1 /100 | #270 | Tragic 5.1% |
| Israelis | 0.1 /100 | #271 | Tragic 5.2% |
| Haitians | 0.1 /100 | #272 | Tragic 5.2% |
| Immigrants | Spain | 0.1 /100 | #273 | Tragic 5.2% |
| Hopi | 0.1 /100 | #274 | Tragic 5.2% |
| Immigrants | Hong Kong | 0.1 /100 | #275 | Tragic 5.2% |
| Central Americans | 0.0 /100 | #276 | Tragic 5.2% |
| Immigrants | Caribbean | 0.0 /100 | #277 | Tragic 5.2% |
| Guatemalans | 0.0 /100 | #278 | Tragic 5.2% |
| Nepalese | 0.0 /100 | #279 | Tragic 5.2% |
| French American Indians | 0.0 /100 | #280 | Tragic 5.2% |
| Immigrants | Haiti | 0.0 /100 | #281 | Tragic 5.2% |
| Mexicans | 0.0 /100 | #282 | Tragic 5.2% |
| Immigrants | Guatemala | 0.0 /100 | #283 | Tragic 5.3% |
| Taiwanese | 0.0 /100 | #284 | Tragic 5.3% |
Demographics Similar to Immigrants from Belize by Unemployment Among Ages 60 to 64 years
In terms of unemployment among ages 60 to 64 years, the demographic groups most similar to Immigrants from Belize are Native/Alaskan (5.7%, a difference of 0.49%), Shoshone (5.7%, a difference of 0.54%), Colville (5.7%, a difference of 0.77%), Dutch West Indian (5.7%, a difference of 0.82%), and Ecuadorian (5.8%, a difference of 1.2%).
| Demographics | Rating | Rank | Unemployment Among Ages 60 to 64 years |
| Immigrants | West Indies | 0.0 /100 | #312 | Tragic 5.5% |
| Belizeans | 0.0 /100 | #313 | Tragic 5.5% |
| Guyanese | 0.0 /100 | #314 | Tragic 5.5% |
| Cree | 0.0 /100 | #315 | Tragic 5.6% |
| Cheyenne | 0.0 /100 | #316 | Tragic 5.6% |
| Shoshone | 0.0 /100 | #317 | Tragic 5.7% |
| Natives/Alaskans | 0.0 /100 | #318 | Tragic 5.7% |
| Immigrants | Belize | 0.0 /100 | #319 | Tragic 5.7% |
| Colville | 0.0 /100 | #320 | Tragic 5.7% |
| Dutch West Indians | 0.0 /100 | #321 | Tragic 5.7% |
| Ecuadorians | 0.0 /100 | #322 | Tragic 5.8% |
| Alsatians | 0.0 /100 | #323 | Tragic 5.8% |
| Immigrants | Ecuador | 0.0 /100 | #324 | Tragic 5.8% |
| Paiute | 0.0 /100 | #325 | Tragic 5.8% |
| Immigrants | St. Vincent and the Grenadines | 0.0 /100 | #326 | Tragic 5.9% |