Immigrants from Cameroon vs Immigrants from Guyana Disability Age 18 to 34
COMPARE
Immigrants from Cameroon
Immigrants from Guyana
Disability Age 18 to 34
Disability Age 18 to 34 Comparison
Immigrants from Cameroon
Immigrants from Guyana
6.7%
DISABILITY AGE 18 TO 34
34.5/ 100
METRIC RATING
188th/ 347
METRIC RANK
5.5%
DISABILITY AGE 18 TO 34
100.0/ 100
METRIC RATING
8th/ 347
METRIC RANK
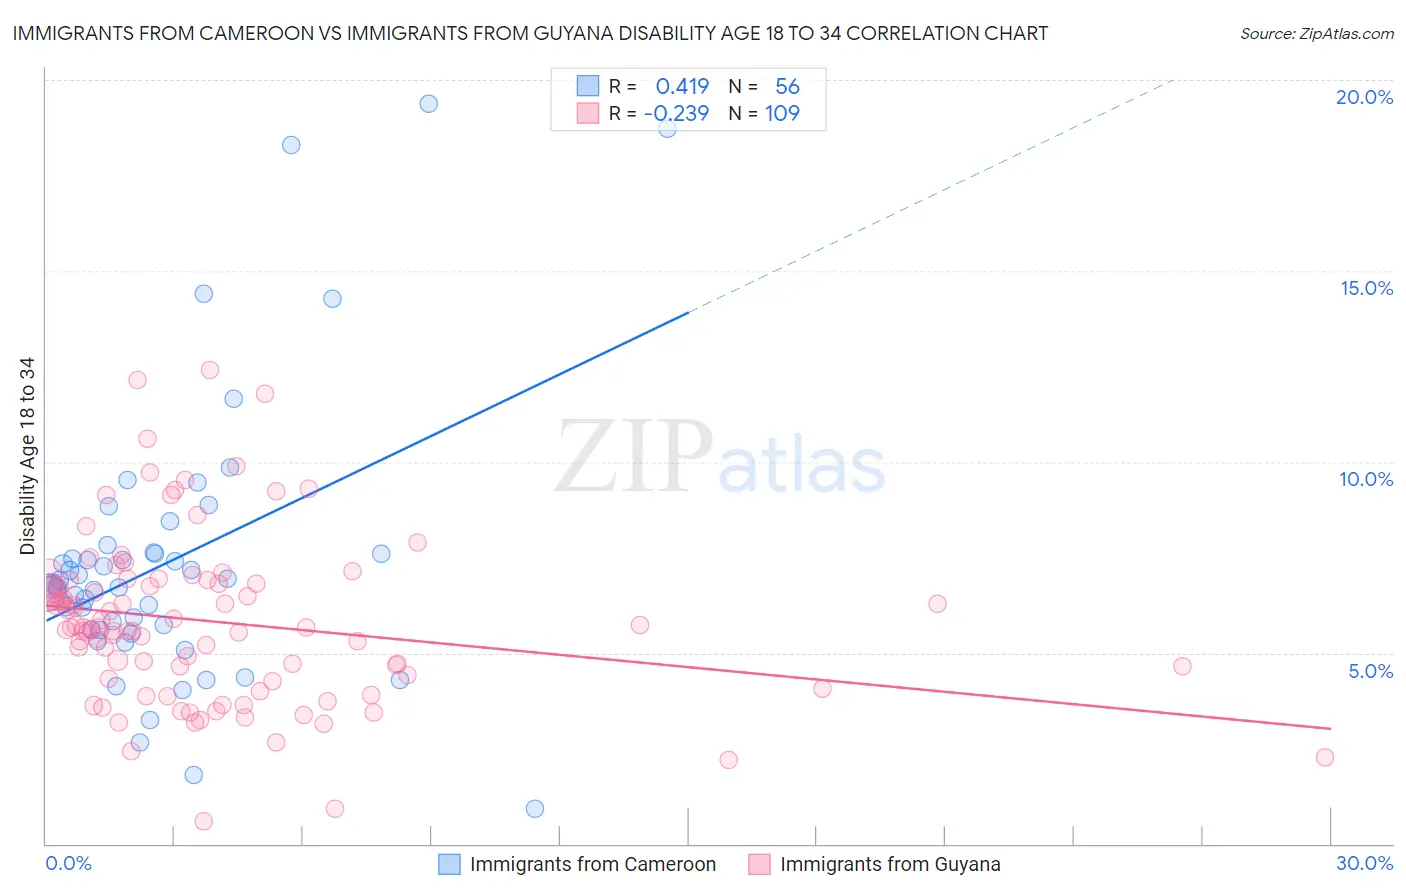
Immigrants from Cameroon vs Immigrants from Guyana Disability Age 18 to 34 Correlation Chart
The statistical analysis conducted on geographies consisting of 130,717,847 people shows a moderate positive correlation between the proportion of Immigrants from Cameroon and percentage of population with a disability between the ages 18 and 35 in the United States with a correlation coefficient (R) of 0.419 and weighted average of 6.7%. Similarly, the statistical analysis conducted on geographies consisting of 183,492,322 people shows a weak negative correlation between the proportion of Immigrants from Guyana and percentage of population with a disability between the ages 18 and 35 in the United States with a correlation coefficient (R) of -0.239 and weighted average of 5.5%, a difference of 21.7%.
Disability Age 18 to 34 Correlation Summary
| Measurement | Immigrants from Cameroon | Immigrants from Guyana |
| Minimum | 0.90% | 0.58% |
| Maximum | 19.4% | 12.4% |
| Range | 18.5% | 11.8% |
| Mean | 7.4% | 5.8% |
| Median | 6.8% | 5.7% |
| Interquartile 25% (IQ1) | 5.6% | 4.3% |
| Interquartile 75% (IQ3) | 7.6% | 6.9% |
| Interquartile Range (IQR) | 2.0% | 2.6% |
| Standard Deviation (Sample) | 3.6% | 2.2% |
| Standard Deviation (Population) | 3.6% | 2.2% |
Similar Demographics by Disability Age 18 to 34
Demographics Similar to Immigrants from Cameroon by Disability Age 18 to 34
In terms of disability age 18 to 34, the demographic groups most similar to Immigrants from Cameroon are Maltese (6.7%, a difference of 0.020%), Yup'ik (6.7%, a difference of 0.060%), Pakistani (6.7%, a difference of 0.060%), Immigrants from Oceania (6.7%, a difference of 0.070%), and Immigrants from Zimbabwe (6.7%, a difference of 0.070%).
| Demographics | Rating | Rank | Disability Age 18 to 34 |
| Romanians | 39.5 /100 | #181 | Fair 6.6% |
| U.S. Virgin Islanders | 38.6 /100 | #182 | Fair 6.7% |
| Immigrants | Iraq | 37.4 /100 | #183 | Fair 6.7% |
| Iraqis | 37.4 /100 | #184 | Fair 6.7% |
| Immigrants | Oceania | 35.4 /100 | #185 | Fair 6.7% |
| Yup'ik | 35.3 /100 | #186 | Fair 6.7% |
| Maltese | 34.8 /100 | #187 | Fair 6.7% |
| Immigrants | Cameroon | 34.5 /100 | #188 | Fair 6.7% |
| Pakistanis | 33.7 /100 | #189 | Fair 6.7% |
| Immigrants | Zimbabwe | 33.6 /100 | #190 | Fair 6.7% |
| Immigrants | Eastern Africa | 33.2 /100 | #191 | Fair 6.7% |
| Immigrants | Western Africa | 28.3 /100 | #192 | Fair 6.7% |
| Immigrants | Uganda | 25.1 /100 | #193 | Fair 6.7% |
| Immigrants | Sudan | 24.9 /100 | #194 | Fair 6.7% |
| Mexican American Indians | 22.3 /100 | #195 | Fair 6.7% |
Demographics Similar to Immigrants from Guyana by Disability Age 18 to 34
In terms of disability age 18 to 34, the demographic groups most similar to Immigrants from Guyana are Guyanese (5.5%, a difference of 0.50%), Immigrants from China (5.4%, a difference of 0.56%), Filipino (5.4%, a difference of 0.64%), Immigrants from Uzbekistan (5.5%, a difference of 0.65%), and Vietnamese (5.5%, a difference of 0.72%).
| Demographics | Rating | Rank | Disability Age 18 to 34 |
| Immigrants | Armenia | 100.0 /100 | #1 | Exceptional 5.0% |
| Immigrants | Hong Kong | 100.0 /100 | #2 | Exceptional 5.2% |
| Immigrants | Grenada | 100.0 /100 | #3 | Exceptional 5.3% |
| Immigrants | Cuba | 100.0 /100 | #4 | Exceptional 5.4% |
| Immigrants | Taiwan | 100.0 /100 | #5 | Exceptional 5.4% |
| Filipinos | 100.0 /100 | #6 | Exceptional 5.4% |
| Immigrants | China | 100.0 /100 | #7 | Exceptional 5.4% |
| Immigrants | Guyana | 100.0 /100 | #8 | Exceptional 5.5% |
| Guyanese | 100.0 /100 | #9 | Exceptional 5.5% |
| Immigrants | Uzbekistan | 100.0 /100 | #10 | Exceptional 5.5% |
| Vietnamese | 100.0 /100 | #11 | Exceptional 5.5% |
| Immigrants | St. Vincent and the Grenadines | 100.0 /100 | #12 | Exceptional 5.5% |
| Immigrants | Iran | 100.0 /100 | #13 | Exceptional 5.5% |
| Indians (Asian) | 100.0 /100 | #14 | Exceptional 5.5% |
| Immigrants | India | 100.0 /100 | #15 | Exceptional 5.6% |