Immigrants from Cabo Verde vs Immigrants from Spain 9th Grade
COMPARE
Immigrants from Cabo Verde
Immigrants from Spain
9th Grade
9th Grade Comparison
Immigrants from Cabo Verde
Immigrants from Spain
90.9%
9TH GRADE
0.0/ 100
METRIC RATING
330th/ 347
METRIC RANK
94.9%
9TH GRADE
49.1/ 100
METRIC RATING
176th/ 347
METRIC RANK
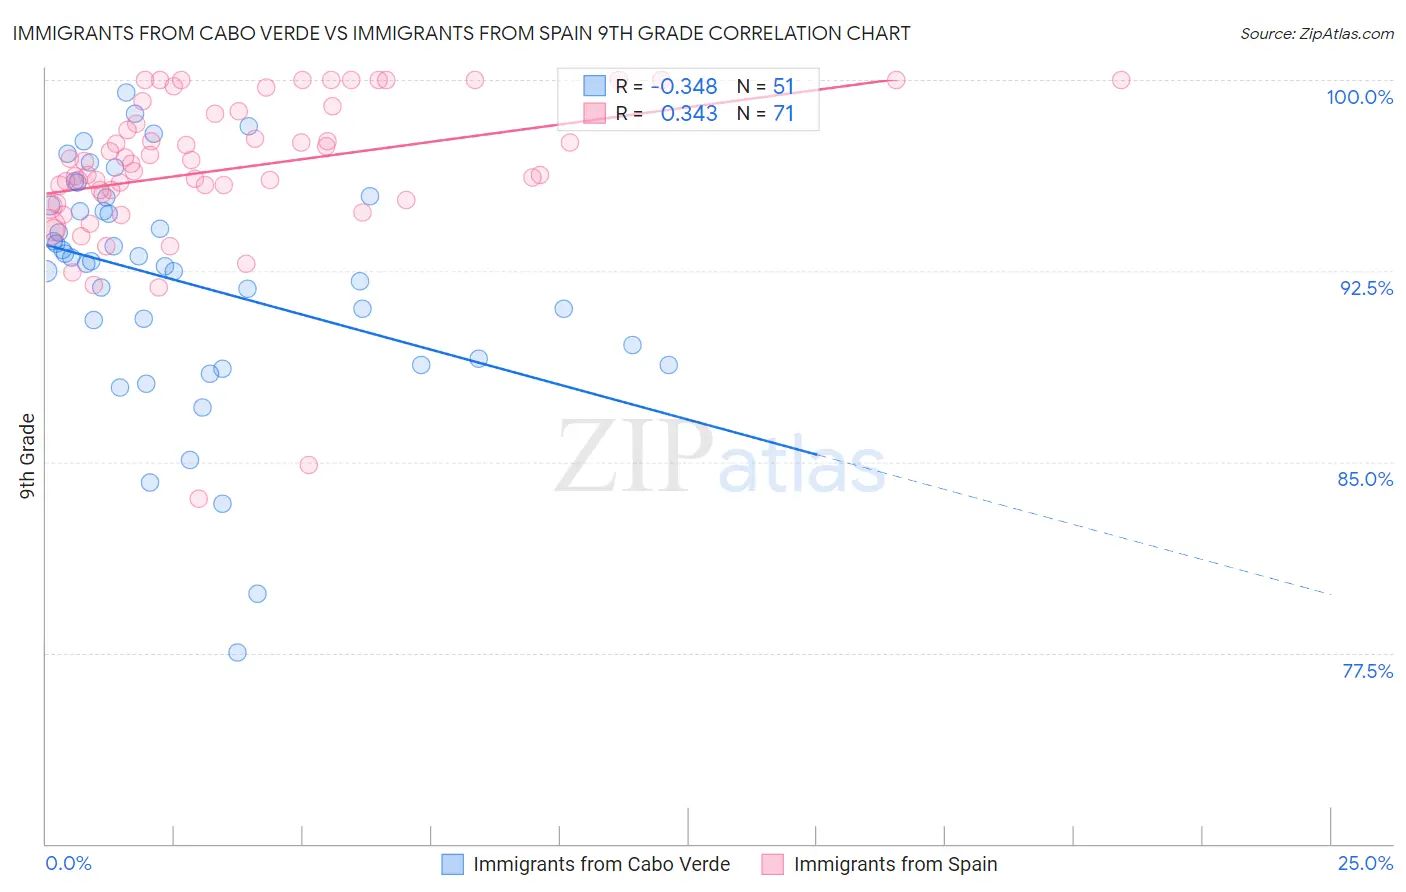
Immigrants from Cabo Verde vs Immigrants from Spain 9th Grade Correlation Chart
The statistical analysis conducted on geographies consisting of 38,158,316 people shows a mild negative correlation between the proportion of Immigrants from Cabo Verde and percentage of population with at least 9th grade education in the United States with a correlation coefficient (R) of -0.348 and weighted average of 90.9%. Similarly, the statistical analysis conducted on geographies consisting of 239,621,997 people shows a mild positive correlation between the proportion of Immigrants from Spain and percentage of population with at least 9th grade education in the United States with a correlation coefficient (R) of 0.343 and weighted average of 94.9%, a difference of 4.3%.
9th Grade Correlation Summary
| Measurement | Immigrants from Cabo Verde | Immigrants from Spain |
| Minimum | 77.5% | 83.6% |
| Maximum | 99.5% | 100.0% |
| Range | 22.0% | 16.4% |
| Mean | 92.1% | 96.5% |
| Median | 92.9% | 96.7% |
| Interquartile 25% (IQ1) | 89.1% | 95.3% |
| Interquartile 75% (IQ3) | 95.1% | 98.8% |
| Interquartile Range (IQR) | 6.0% | 3.4% |
| Standard Deviation (Sample) | 4.6% | 3.1% |
| Standard Deviation (Population) | 4.5% | 3.0% |
Similar Demographics by 9th Grade
Demographics Similar to Immigrants from Cabo Verde by 9th Grade
In terms of 9th grade, the demographic groups most similar to Immigrants from Cabo Verde are Mexican American Indian (90.9%, a difference of 0.030%), Hispanic or Latino (90.9%, a difference of 0.050%), Honduran (91.0%, a difference of 0.12%), Immigrants from Yemen (90.8%, a difference of 0.14%), and Dominican (91.1%, a difference of 0.15%).
| Demographics | Rating | Rank | 9th Grade |
| Puerto Ricans | 0.0 /100 | #323 | Tragic 91.8% |
| Immigrants | Belize | 0.0 /100 | #324 | Tragic 91.8% |
| Central American Indians | 0.0 /100 | #325 | Tragic 91.5% |
| Immigrants | Armenia | 0.0 /100 | #326 | Tragic 91.4% |
| Immigrants | Nicaragua | 0.0 /100 | #327 | Tragic 91.3% |
| Dominicans | 0.0 /100 | #328 | Tragic 91.1% |
| Hondurans | 0.0 /100 | #329 | Tragic 91.0% |
| Immigrants | Cabo Verde | 0.0 /100 | #330 | Tragic 90.9% |
| Mexican American Indians | 0.0 /100 | #331 | Tragic 90.9% |
| Hispanics or Latinos | 0.0 /100 | #332 | Tragic 90.9% |
| Immigrants | Yemen | 0.0 /100 | #333 | Tragic 90.8% |
| Immigrants | Azores | 0.0 /100 | #334 | Tragic 90.8% |
| Immigrants | Honduras | 0.0 /100 | #335 | Tragic 90.6% |
| Immigrants | Dominican Republic | 0.0 /100 | #336 | Tragic 90.5% |
| Immigrants | Latin America | 0.0 /100 | #337 | Tragic 90.4% |
Demographics Similar to Immigrants from Spain by 9th Grade
In terms of 9th grade, the demographic groups most similar to Immigrants from Spain are Immigrants from Egypt (94.9%, a difference of 0.010%), Brazilian (94.9%, a difference of 0.010%), Immigrants from Iraq (94.9%, a difference of 0.010%), Cheyenne (94.9%, a difference of 0.020%), and Immigrants from Poland (94.9%, a difference of 0.020%).
| Demographics | Rating | Rank | 9th Grade |
| Spaniards | 59.6 /100 | #169 | Average 94.9% |
| Alsatians | 58.6 /100 | #170 | Average 94.9% |
| Colville | 58.5 /100 | #171 | Average 94.9% |
| Iraqis | 54.0 /100 | #172 | Average 94.9% |
| Cheyenne | 51.5 /100 | #173 | Average 94.9% |
| Immigrants | Egypt | 50.0 /100 | #174 | Average 94.9% |
| Brazilians | 49.8 /100 | #175 | Average 94.9% |
| Immigrants | Spain | 49.1 /100 | #176 | Average 94.9% |
| Immigrants | Iraq | 47.8 /100 | #177 | Average 94.9% |
| Immigrants | Poland | 46.7 /100 | #178 | Average 94.9% |
| Immigrants | Venezuela | 46.5 /100 | #179 | Average 94.9% |
| Immigrants | Uganda | 43.1 /100 | #180 | Average 94.8% |
| Sierra Leoneans | 42.7 /100 | #181 | Average 94.8% |
| Seminole | 42.5 /100 | #182 | Average 94.8% |
| Immigrants | Nepal | 39.7 /100 | #183 | Fair 94.8% |