Immigrants from North America vs Immigrants from Morocco Male Disability
COMPARE
Immigrants from North America
Immigrants from Morocco
Male Disability
Male Disability Comparison
Immigrants from North America
Immigrants from Morocco
11.9%
MALE DISABILITY
1.5/ 100
METRIC RATING
235th/ 347
METRIC RANK
10.6%
MALE DISABILITY
97.7/ 100
METRIC RATING
90th/ 347
METRIC RANK
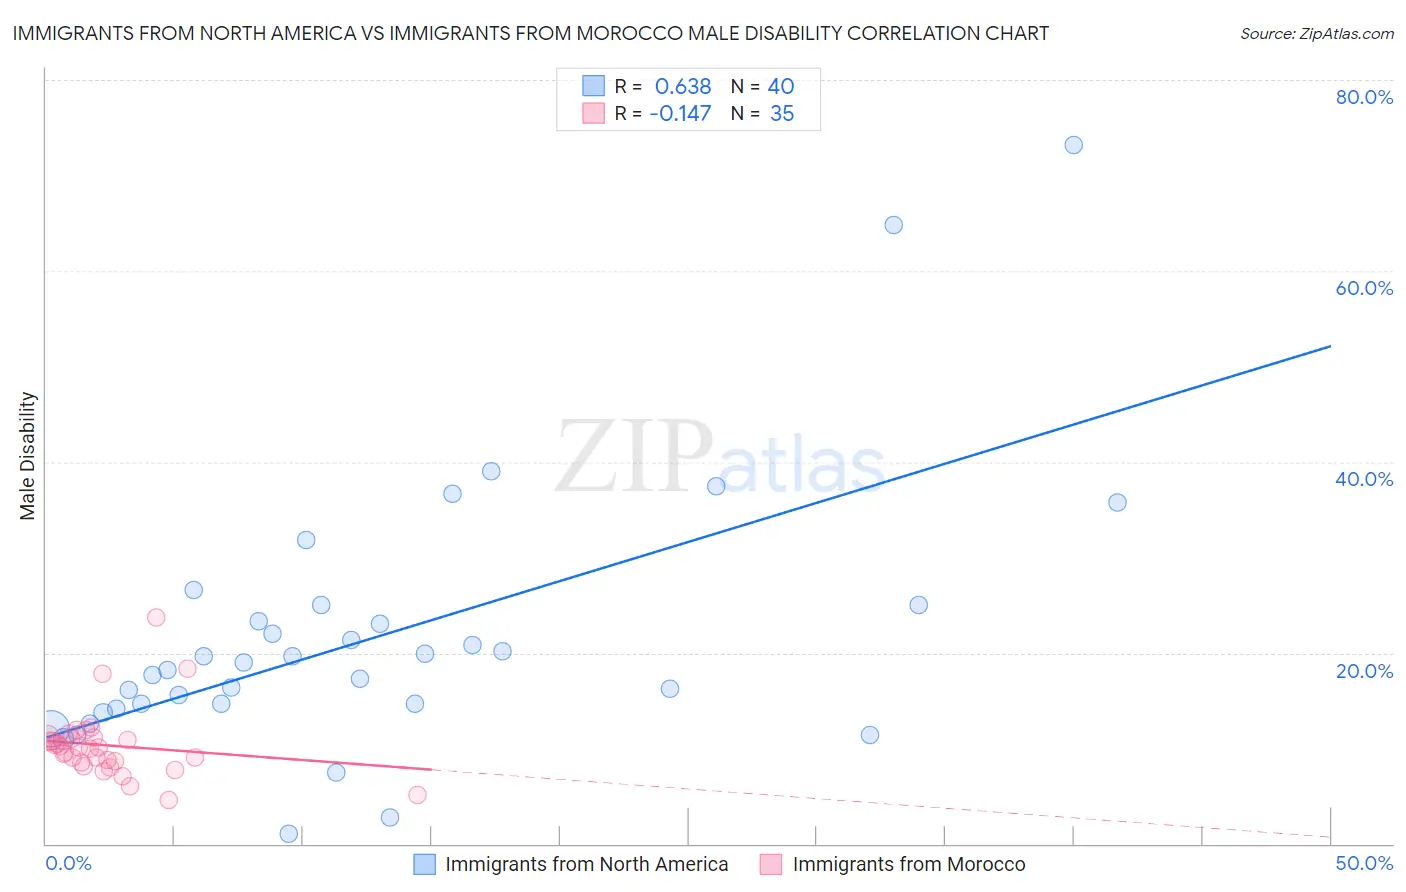
Immigrants from North America vs Immigrants from Morocco Male Disability Correlation Chart
The statistical analysis conducted on geographies consisting of 462,399,243 people shows a significant positive correlation between the proportion of Immigrants from North America and percentage of males with a disability in the United States with a correlation coefficient (R) of 0.638 and weighted average of 11.9%. Similarly, the statistical analysis conducted on geographies consisting of 178,909,638 people shows a poor negative correlation between the proportion of Immigrants from Morocco and percentage of males with a disability in the United States with a correlation coefficient (R) of -0.147 and weighted average of 10.6%, a difference of 11.6%.
Male Disability Correlation Summary
| Measurement | Immigrants from North America | Immigrants from Morocco |
| Minimum | 1.0% | 4.6% |
| Maximum | 73.2% | 23.6% |
| Range | 72.2% | 19.0% |
| Mean | 21.6% | 10.3% |
| Median | 18.6% | 10.0% |
| Interquartile 25% (IQ1) | 14.4% | 8.5% |
| Interquartile 75% (IQ3) | 24.1% | 11.1% |
| Interquartile Range (IQR) | 9.8% | 2.5% |
| Standard Deviation (Sample) | 14.0% | 3.6% |
| Standard Deviation (Population) | 13.8% | 3.5% |
Similar Demographics by Male Disability
Demographics Similar to Immigrants from North America by Male Disability
In terms of male disability, the demographic groups most similar to Immigrants from North America are Immigrants from Canada (11.9%, a difference of 0.13%), U.S. Virgin Islander (11.9%, a difference of 0.14%), Carpatho Rusyn (11.9%, a difference of 0.15%), Mexican (11.8%, a difference of 0.20%), and Malaysian (11.8%, a difference of 0.24%).
| Demographics | Rating | Rank | Male Disability |
| Hispanics or Latinos | 2.3 /100 | #228 | Tragic 11.8% |
| Bermudans | 2.3 /100 | #229 | Tragic 11.8% |
| Croatians | 2.1 /100 | #230 | Tragic 11.8% |
| Dominicans | 1.8 /100 | #231 | Tragic 11.8% |
| Malaysians | 1.8 /100 | #232 | Tragic 11.8% |
| Mexicans | 1.7 /100 | #233 | Tragic 11.8% |
| Immigrants | Canada | 1.6 /100 | #234 | Tragic 11.9% |
| Immigrants | North America | 1.5 /100 | #235 | Tragic 11.9% |
| U.S. Virgin Islanders | 1.3 /100 | #236 | Tragic 11.9% |
| Carpatho Rusyns | 1.3 /100 | #237 | Tragic 11.9% |
| Yugoslavians | 1.2 /100 | #238 | Tragic 11.9% |
| Italians | 1.2 /100 | #239 | Tragic 11.9% |
| Czechs | 1.1 /100 | #240 | Tragic 11.9% |
| Bahamians | 1.1 /100 | #241 | Tragic 11.9% |
| Northern Europeans | 1.1 /100 | #242 | Tragic 11.9% |
Demographics Similar to Immigrants from Morocco by Male Disability
In terms of male disability, the demographic groups most similar to Immigrants from Morocco are Immigrants from France (10.6%, a difference of 0.040%), Immigrants from Western Asia (10.6%, a difference of 0.050%), Immigrants from Nicaragua (10.6%, a difference of 0.050%), Immigrants from Vietnam (10.6%, a difference of 0.12%), and Immigrants from Ireland (10.6%, a difference of 0.14%).
| Demographics | Rating | Rank | Male Disability |
| Immigrants | Poland | 98.1 /100 | #83 | Exceptional 10.6% |
| Bulgarians | 98.1 /100 | #84 | Exceptional 10.6% |
| Sri Lankans | 97.9 /100 | #85 | Exceptional 10.6% |
| Immigrants | Ireland | 97.9 /100 | #86 | Exceptional 10.6% |
| Immigrants | Vietnam | 97.9 /100 | #87 | Exceptional 10.6% |
| Immigrants | Western Asia | 97.8 /100 | #88 | Exceptional 10.6% |
| Immigrants | Nicaragua | 97.8 /100 | #89 | Exceptional 10.6% |
| Immigrants | Morocco | 97.7 /100 | #90 | Exceptional 10.6% |
| Immigrants | France | 97.6 /100 | #91 | Exceptional 10.6% |
| Palestinians | 97.4 /100 | #92 | Exceptional 10.7% |
| Immigrants | St. Vincent and the Grenadines | 97.1 /100 | #93 | Exceptional 10.7% |
| Immigrants | Sweden | 96.9 /100 | #94 | Exceptional 10.7% |
| Chileans | 96.9 /100 | #95 | Exceptional 10.7% |
| Nicaraguans | 96.6 /100 | #96 | Exceptional 10.7% |
| Immigrants | Armenia | 96.6 /100 | #97 | Exceptional 10.7% |