Immigrants from Brazil vs Alaska Native Disability Age Under 5
COMPARE
Immigrants from Brazil
Alaska Native
Disability Age Under 5
Disability Age Under 5 Comparison
Immigrants from Brazil
Alaska Natives
1.4%
DISABILITY AGE UNDER 5
0.7/ 100
METRIC RATING
254th/ 347
METRIC RANK
2.9%
DISABILITY AGE UNDER 5
0.0/ 100
METRIC RATING
342nd/ 347
METRIC RANK
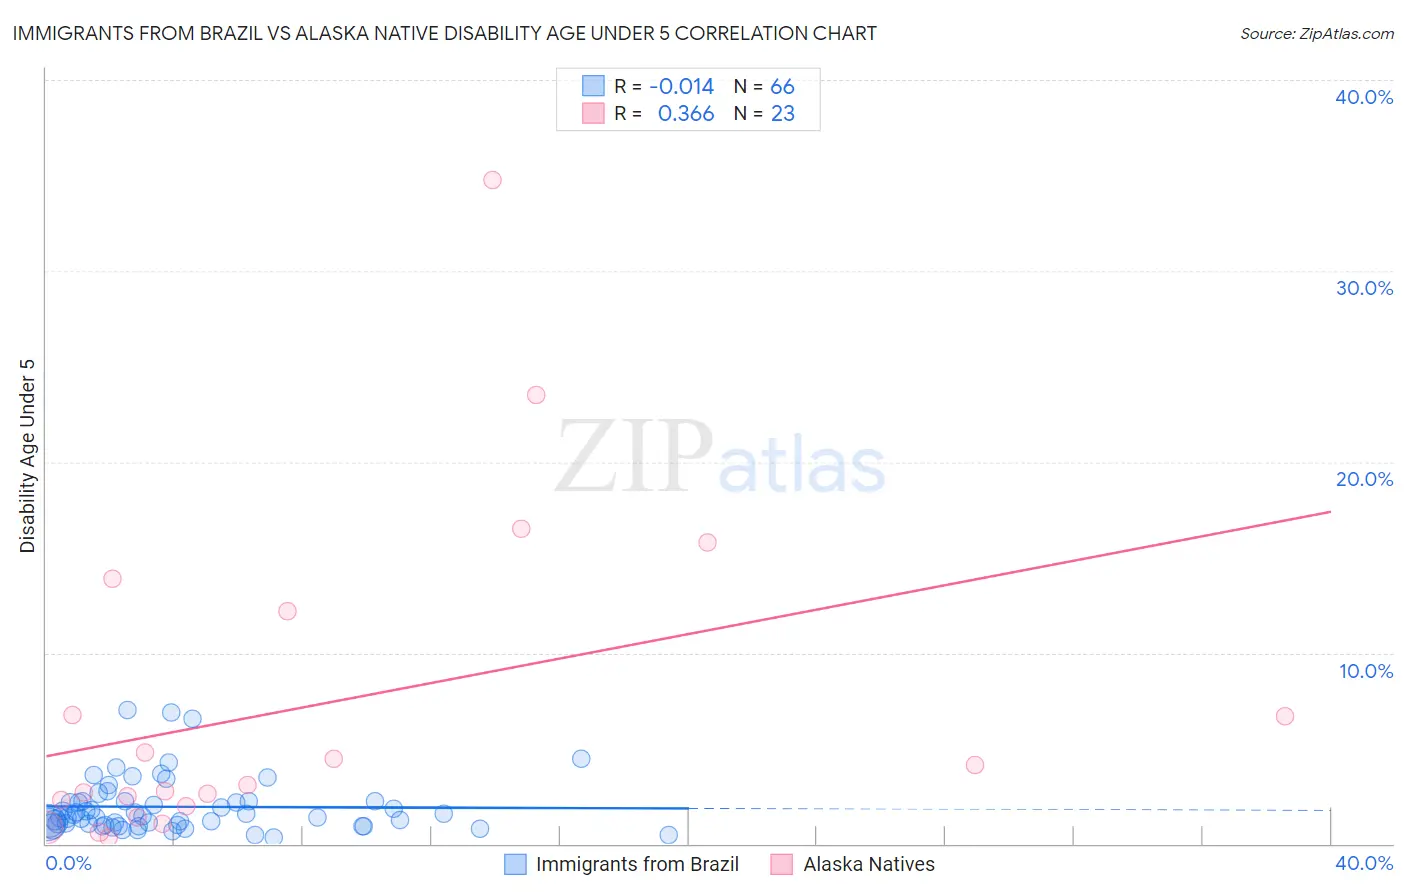
Immigrants from Brazil vs Alaska Native Disability Age Under 5 Correlation Chart
The statistical analysis conducted on geographies consisting of 192,252,216 people shows no correlation between the proportion of Immigrants from Brazil and percentage of population with a disability under the age of 5 in the United States with a correlation coefficient (R) of -0.014 and weighted average of 1.4%. Similarly, the statistical analysis conducted on geographies consisting of 62,848,423 people shows a mild positive correlation between the proportion of Alaska Natives and percentage of population with a disability under the age of 5 in the United States with a correlation coefficient (R) of 0.366 and weighted average of 2.9%, a difference of 113.0%.
Disability Age Under 5 Correlation Summary
| Measurement | Immigrants from Brazil | Alaska Native |
| Minimum | 0.34% | 0.35% |
| Maximum | 7.0% | 34.8% |
| Range | 6.7% | 34.4% |
| Mean | 1.9% | 7.2% |
| Median | 1.4% | 3.1% |
| Interquartile 25% (IQ1) | 0.98% | 2.0% |
| Interquartile 75% (IQ3) | 2.2% | 12.2% |
| Interquartile Range (IQR) | 1.2% | 10.2% |
| Standard Deviation (Sample) | 1.4% | 8.6% |
| Standard Deviation (Population) | 1.4% | 8.4% |
Similar Demographics by Disability Age Under 5
Demographics Similar to Immigrants from Brazil by Disability Age Under 5
In terms of disability age under 5, the demographic groups most similar to Immigrants from Brazil are Immigrants from Liberia (1.4%, a difference of 0.060%), Australian (1.4%, a difference of 0.080%), Immigrants from Western Europe (1.4%, a difference of 0.48%), Immigrants from Scotland (1.4%, a difference of 0.76%), and Immigrants from Hungary (1.4%, a difference of 0.80%).
| Demographics | Rating | Rank | Disability Age Under 5 |
| Immigrants | England | 1.0 /100 | #247 | Tragic 1.4% |
| Eastern Europeans | 1.0 /100 | #248 | Tragic 1.4% |
| Bermudans | 1.0 /100 | #249 | Tragic 1.4% |
| Africans | 1.0 /100 | #250 | Tragic 1.4% |
| Immigrants | Hungary | 1.0 /100 | #251 | Tragic 1.4% |
| Immigrants | Scotland | 0.9 /100 | #252 | Tragic 1.4% |
| Australians | 0.7 /100 | #253 | Tragic 1.4% |
| Immigrants | Brazil | 0.7 /100 | #254 | Tragic 1.4% |
| Immigrants | Liberia | 0.6 /100 | #255 | Tragic 1.4% |
| Immigrants | Western Europe | 0.5 /100 | #256 | Tragic 1.4% |
| Slovenes | 0.3 /100 | #257 | Tragic 1.4% |
| Costa Ricans | 0.3 /100 | #258 | Tragic 1.4% |
| Immigrants | Southern Europe | 0.3 /100 | #259 | Tragic 1.4% |
| Slavs | 0.3 /100 | #260 | Tragic 1.4% |
| Immigrants | Netherlands | 0.2 /100 | #261 | Tragic 1.4% |
Demographics Similar to Alaska Natives by Disability Age Under 5
In terms of disability age under 5, the demographic groups most similar to Alaska Natives are Colville (3.3%, a difference of 11.6%), Tsimshian (2.4%, a difference of 22.1%), Inupiat (3.7%, a difference of 26.1%), Menominee (2.3%, a difference of 28.1%), and Immigrants from the Azores (2.2%, a difference of 31.6%).
| Demographics | Rating | Rank | Disability Age Under 5 |
| Dutch West Indians | 0.0 /100 | #333 | Tragic 1.9% |
| Natives/Alaskans | 0.0 /100 | #334 | Tragic 1.9% |
| Pennsylvania Germans | 0.0 /100 | #335 | Tragic 1.9% |
| Paraguayans | 0.0 /100 | #336 | Tragic 2.0% |
| Apache | 0.0 /100 | #337 | Tragic 2.0% |
| Tohono O'odham | 0.0 /100 | #338 | Tragic 2.2% |
| Immigrants | Azores | 0.0 /100 | #339 | Tragic 2.2% |
| Menominee | 0.0 /100 | #340 | Tragic 2.3% |
| Tsimshian | 0.0 /100 | #341 | Tragic 2.4% |
| Alaska Natives | 0.0 /100 | #342 | Tragic 2.9% |
| Colville | 0.0 /100 | #343 | Tragic 3.3% |
| Inupiat | 0.0 /100 | #344 | Tragic 3.7% |
| Paiute | 0.0 /100 | #345 | Tragic 3.9% |
| Yup'ik | 0.0 /100 | #346 | Tragic 4.5% |
| Hopi | 0.0 /100 | #347 | Tragic 4.6% |