Immigrants from Belize vs Costa Rican Disability Age Over 75
COMPARE
Immigrants from Belize
Costa Rican
Disability Age Over 75
Disability Age Over 75 Comparison
Immigrants from Belize
Costa Ricans
49.6%
DISABILITY AGE OVER 75
0.0/ 100
METRIC RATING
286th/ 347
METRIC RANK
46.9%
DISABILITY AGE OVER 75
84.5/ 100
METRIC RATING
145th/ 347
METRIC RANK
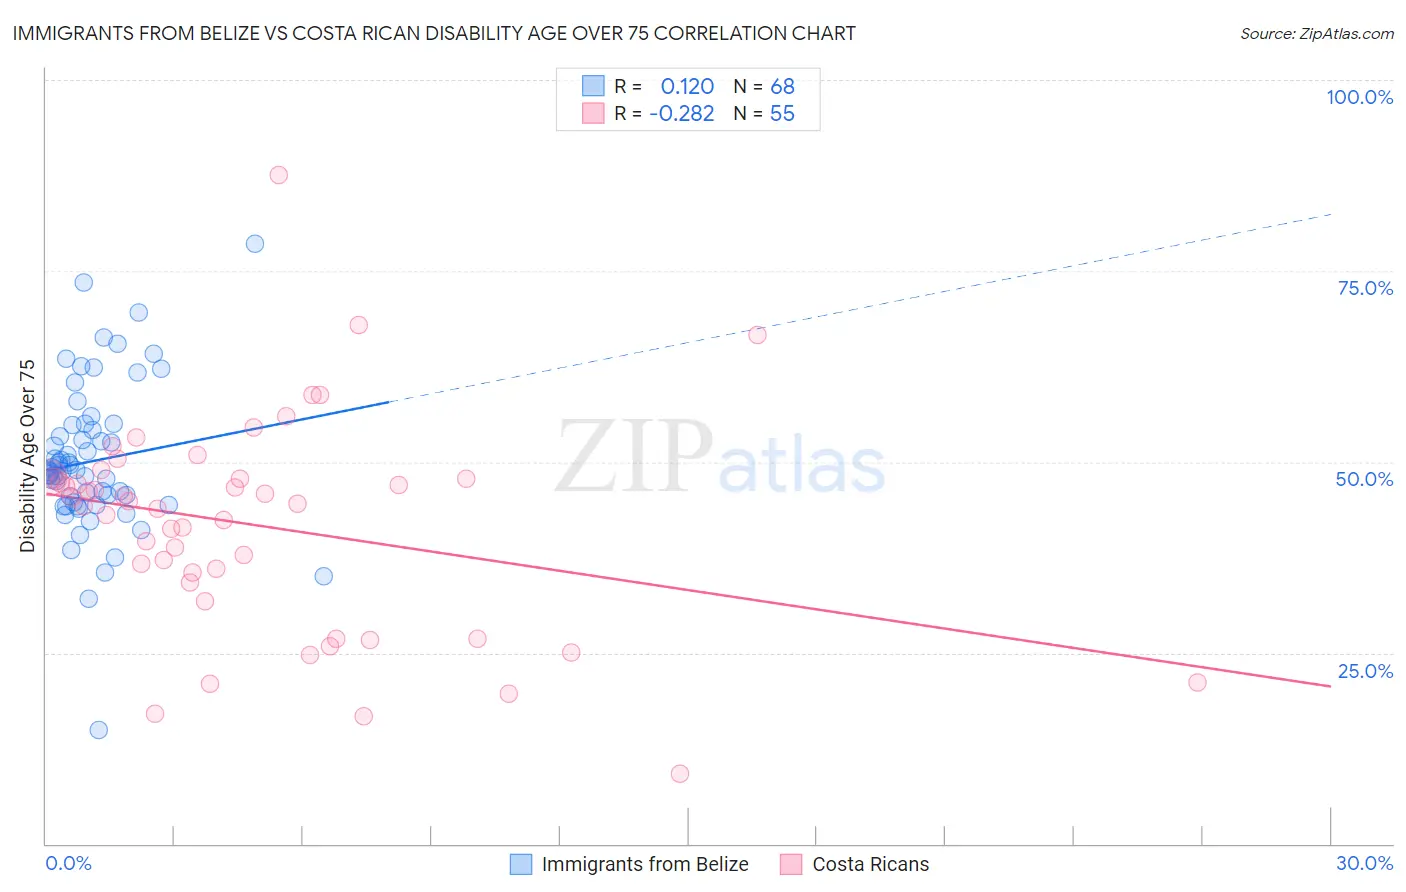
Immigrants from Belize vs Costa Rican Disability Age Over 75 Correlation Chart
The statistical analysis conducted on geographies consisting of 130,240,779 people shows a poor positive correlation between the proportion of Immigrants from Belize and percentage of population with a disability over the age of 75 in the United States with a correlation coefficient (R) of 0.120 and weighted average of 49.6%. Similarly, the statistical analysis conducted on geographies consisting of 253,327,132 people shows a weak negative correlation between the proportion of Costa Ricans and percentage of population with a disability over the age of 75 in the United States with a correlation coefficient (R) of -0.282 and weighted average of 46.9%, a difference of 5.9%.
Disability Age Over 75 Correlation Summary
| Measurement | Immigrants from Belize | Costa Rican |
| Minimum | 14.9% | 9.1% |
| Maximum | 78.6% | 87.5% |
| Range | 63.7% | 78.4% |
| Mean | 50.1% | 41.7% |
| Median | 48.8% | 44.5% |
| Interquartile 25% (IQ1) | 44.5% | 34.2% |
| Interquartile 75% (IQ3) | 54.5% | 47.9% |
| Interquartile Range (IQR) | 10.0% | 13.6% |
| Standard Deviation (Sample) | 9.9% | 14.0% |
| Standard Deviation (Population) | 9.8% | 13.9% |
Similar Demographics by Disability Age Over 75
Demographics Similar to Immigrants from Belize by Disability Age Over 75
In terms of disability age over 75, the demographic groups most similar to Immigrants from Belize are Crow (49.6%, a difference of 0.080%), Sioux (49.7%, a difference of 0.21%), Immigrants from Latin America (49.5%, a difference of 0.22%), Yaqui (49.8%, a difference of 0.26%), and Samoan (49.5%, a difference of 0.27%).
| Demographics | Rating | Rank | Disability Age Over 75 |
| Guamanians/Chamorros | 0.0 /100 | #279 | Tragic 49.4% |
| Bangladeshis | 0.0 /100 | #280 | Tragic 49.4% |
| Belizeans | 0.0 /100 | #281 | Tragic 49.4% |
| Blacks/African Americans | 0.0 /100 | #282 | Tragic 49.5% |
| Samoans | 0.0 /100 | #283 | Tragic 49.5% |
| Immigrants | Latin America | 0.0 /100 | #284 | Tragic 49.5% |
| Crow | 0.0 /100 | #285 | Tragic 49.6% |
| Immigrants | Belize | 0.0 /100 | #286 | Tragic 49.6% |
| Sioux | 0.0 /100 | #287 | Tragic 49.7% |
| Yaqui | 0.0 /100 | #288 | Tragic 49.8% |
| Osage | 0.0 /100 | #289 | Tragic 49.8% |
| Puget Sound Salish | 0.0 /100 | #290 | Tragic 49.8% |
| Arapaho | 0.0 /100 | #291 | Tragic 49.8% |
| Shoshone | 0.0 /100 | #292 | Tragic 49.9% |
| Spanish American Indians | 0.0 /100 | #293 | Tragic 49.9% |
Demographics Similar to Costa Ricans by Disability Age Over 75
In terms of disability age over 75, the demographic groups most similar to Costa Ricans are Guyanese (46.9%, a difference of 0.010%), Venezuelan (46.9%, a difference of 0.020%), Immigrants from Peru (46.9%, a difference of 0.020%), Bermudan (46.9%, a difference of 0.050%), and Peruvian (46.8%, a difference of 0.090%).
| Demographics | Rating | Rank | Disability Age Over 75 |
| Immigrants | Bosnia and Herzegovina | 88.5 /100 | #138 | Excellent 46.8% |
| Yugoslavians | 88.5 /100 | #139 | Excellent 46.8% |
| Immigrants | Costa Rica | 87.4 /100 | #140 | Excellent 46.8% |
| Lebanese | 87.0 /100 | #141 | Excellent 46.8% |
| Peruvians | 86.5 /100 | #142 | Excellent 46.8% |
| Bermudans | 85.6 /100 | #143 | Excellent 46.9% |
| Venezuelans | 85.0 /100 | #144 | Excellent 46.9% |
| Costa Ricans | 84.5 /100 | #145 | Excellent 46.9% |
| Guyanese | 84.3 /100 | #146 | Excellent 46.9% |
| Immigrants | Peru | 84.1 /100 | #147 | Excellent 46.9% |
| Asians | 81.6 /100 | #148 | Excellent 46.9% |
| Welsh | 81.3 /100 | #149 | Excellent 47.0% |
| Immigrants | Russia | 79.3 /100 | #150 | Good 47.0% |
| French Canadians | 79.0 /100 | #151 | Good 47.0% |
| Immigrants | Asia | 76.5 /100 | #152 | Good 47.0% |