Immigrants from Barbados vs Panamanian Disability Age 65 to 74
COMPARE
Immigrants from Barbados
Panamanian
Disability Age 65 to 74
Disability Age 65 to 74 Comparison
Immigrants from Barbados
Panamanians
23.8%
DISABILITY AGE 65 TO 74
19.6/ 100
METRIC RATING
208th/ 347
METRIC RANK
24.4%
DISABILITY AGE 65 TO 74
4.2/ 100
METRIC RATING
234th/ 347
METRIC RANK
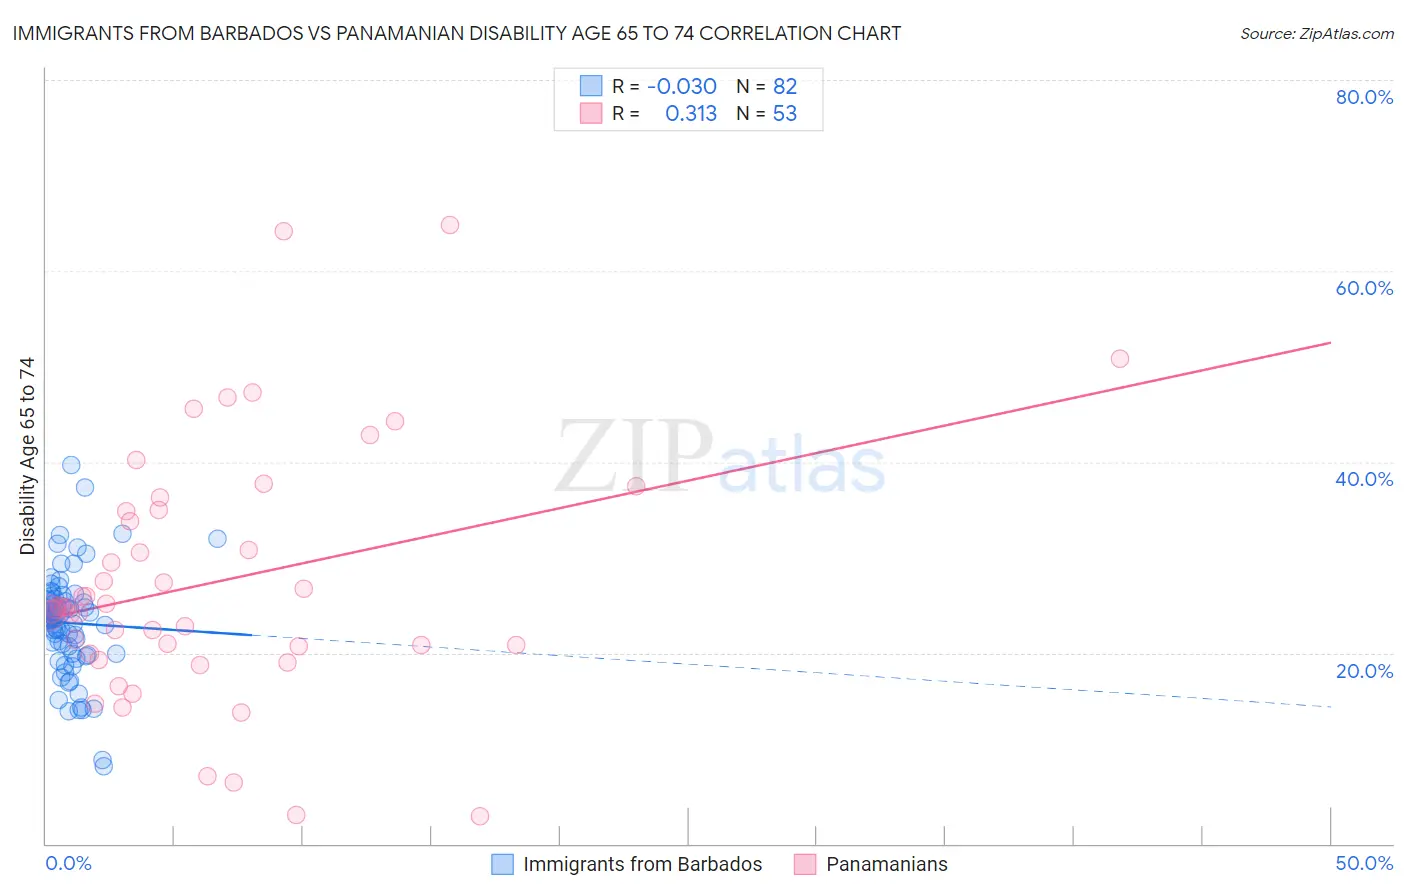
Immigrants from Barbados vs Panamanian Disability Age 65 to 74 Correlation Chart
The statistical analysis conducted on geographies consisting of 112,748,711 people shows no correlation between the proportion of Immigrants from Barbados and percentage of population with a disability between the ages 65 and 75 in the United States with a correlation coefficient (R) of -0.030 and weighted average of 23.8%. Similarly, the statistical analysis conducted on geographies consisting of 280,720,720 people shows a mild positive correlation between the proportion of Panamanians and percentage of population with a disability between the ages 65 and 75 in the United States with a correlation coefficient (R) of 0.313 and weighted average of 24.4%, a difference of 2.5%.
Disability Age 65 to 74 Correlation Summary
| Measurement | Immigrants from Barbados | Panamanian |
| Minimum | 8.1% | 2.9% |
| Maximum | 39.7% | 64.9% |
| Range | 31.6% | 62.0% |
| Mean | 23.1% | 27.4% |
| Median | 23.7% | 24.7% |
| Interquartile 25% (IQ1) | 19.9% | 20.3% |
| Interquartile 75% (IQ3) | 25.6% | 34.9% |
| Interquartile Range (IQR) | 5.6% | 14.6% |
| Standard Deviation (Sample) | 5.4% | 13.2% |
| Standard Deviation (Population) | 5.4% | 13.0% |
Similar Demographics by Disability Age 65 to 74
Demographics Similar to Immigrants from Barbados by Disability Age 65 to 74
In terms of disability age 65 to 74, the demographic groups most similar to Immigrants from Barbados are Immigrants from Kenya (23.8%, a difference of 0.0%), Immigrants from Sudan (23.8%, a difference of 0.040%), Tongan (23.8%, a difference of 0.10%), Immigrants from Jamaica (23.8%, a difference of 0.10%), and Immigrants from Grenada (23.8%, a difference of 0.21%).
| Demographics | Rating | Rank | Disability Age 65 to 74 |
| Immigrants | Ecuador | 23.9 /100 | #201 | Fair 23.7% |
| Immigrants | Bahamas | 23.3 /100 | #202 | Fair 23.7% |
| Kenyans | 23.2 /100 | #203 | Fair 23.7% |
| Immigrants | Grenada | 22.1 /100 | #204 | Fair 23.8% |
| Tongans | 20.8 /100 | #205 | Fair 23.8% |
| Immigrants | Jamaica | 20.7 /100 | #206 | Fair 23.8% |
| Immigrants | Sudan | 20.1 /100 | #207 | Fair 23.8% |
| Immigrants | Barbados | 19.6 /100 | #208 | Poor 23.8% |
| Immigrants | Kenya | 19.6 /100 | #209 | Poor 23.8% |
| Trinidadians and Tobagonians | 16.4 /100 | #210 | Poor 23.9% |
| Immigrants | West Indies | 15.9 /100 | #211 | Poor 23.9% |
| French | 15.7 /100 | #212 | Poor 23.9% |
| Nicaraguans | 14.3 /100 | #213 | Poor 23.9% |
| Immigrants | Oceania | 13.6 /100 | #214 | Poor 24.0% |
| Pennsylvania Germans | 13.3 /100 | #215 | Poor 24.0% |
Demographics Similar to Panamanians by Disability Age 65 to 74
In terms of disability age 65 to 74, the demographic groups most similar to Panamanians are Bahamian (24.4%, a difference of 0.11%), Scotch-Irish (24.4%, a difference of 0.16%), German Russian (24.4%, a difference of 0.19%), Immigrants from Zaire (24.3%, a difference of 0.27%), and West Indian (24.5%, a difference of 0.29%).
| Demographics | Rating | Rank | Disability Age 65 to 74 |
| Nigerians | 7.8 /100 | #227 | Tragic 24.2% |
| Whites/Caucasians | 6.6 /100 | #228 | Tragic 24.2% |
| Celtics | 6.4 /100 | #229 | Tragic 24.2% |
| Barbadians | 6.0 /100 | #230 | Tragic 24.3% |
| Immigrants | Thailand | 5.2 /100 | #231 | Tragic 24.3% |
| Immigrants | Zaire | 5.0 /100 | #232 | Tragic 24.3% |
| Bahamians | 4.5 /100 | #233 | Tragic 24.4% |
| Panamanians | 4.2 /100 | #234 | Tragic 24.4% |
| Scotch-Irish | 3.8 /100 | #235 | Tragic 24.4% |
| German Russians | 3.7 /100 | #236 | Tragic 24.4% |
| West Indians | 3.4 /100 | #237 | Tragic 24.5% |
| Immigrants | Ghana | 3.0 /100 | #238 | Tragic 24.5% |
| Immigrants | Caribbean | 2.6 /100 | #239 | Tragic 24.6% |
| Spaniards | 2.4 /100 | #240 | Tragic 24.6% |
| Immigrants | Western Africa | 2.3 /100 | #241 | Tragic 24.6% |