Immigrants from Bosnia and Herzegovina vs Panamanian Disability Age 65 to 74
COMPARE
Immigrants from Bosnia and Herzegovina
Panamanian
Disability Age 65 to 74
Disability Age 65 to 74 Comparison
Immigrants from Bosnia and Herzegovina
Panamanians
23.2%
DISABILITY AGE 65 TO 74
57.6/ 100
METRIC RATING
167th/ 347
METRIC RANK
24.4%
DISABILITY AGE 65 TO 74
4.2/ 100
METRIC RATING
234th/ 347
METRIC RANK
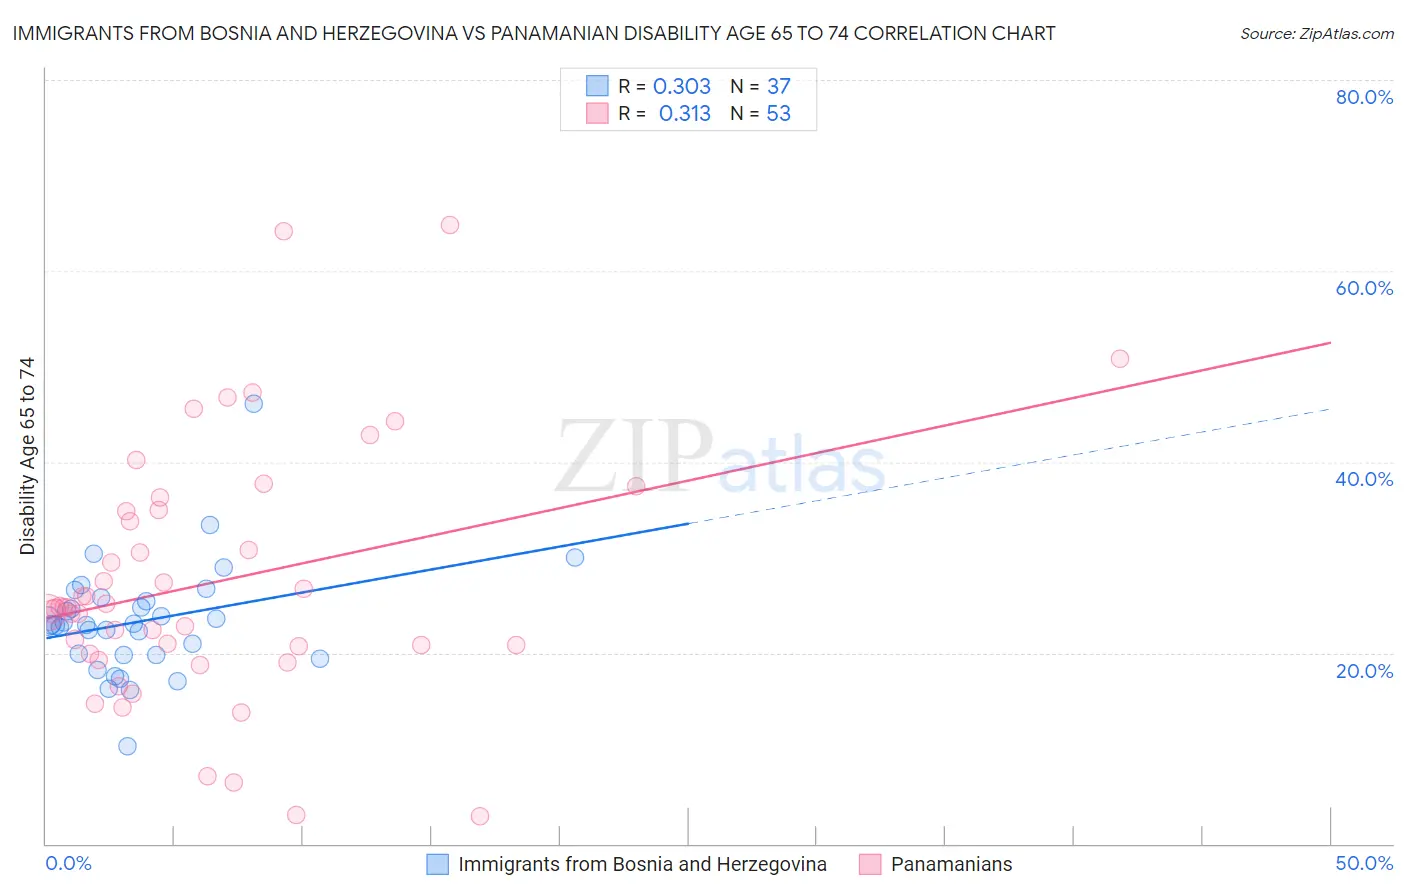
Immigrants from Bosnia and Herzegovina vs Panamanian Disability Age 65 to 74 Correlation Chart
The statistical analysis conducted on geographies consisting of 156,780,738 people shows a mild positive correlation between the proportion of Immigrants from Bosnia and Herzegovina and percentage of population with a disability between the ages 65 and 75 in the United States with a correlation coefficient (R) of 0.303 and weighted average of 23.2%. Similarly, the statistical analysis conducted on geographies consisting of 280,720,720 people shows a mild positive correlation between the proportion of Panamanians and percentage of population with a disability between the ages 65 and 75 in the United States with a correlation coefficient (R) of 0.313 and weighted average of 24.4%, a difference of 5.0%.
Disability Age 65 to 74 Correlation Summary
| Measurement | Immigrants from Bosnia and Herzegovina | Panamanian |
| Minimum | 10.2% | 2.9% |
| Maximum | 46.2% | 64.9% |
| Range | 35.9% | 62.0% |
| Mean | 23.3% | 27.4% |
| Median | 23.0% | 24.7% |
| Interquartile 25% (IQ1) | 19.8% | 20.3% |
| Interquartile 75% (IQ3) | 25.6% | 34.9% |
| Interquartile Range (IQR) | 5.8% | 14.6% |
| Standard Deviation (Sample) | 5.9% | 13.2% |
| Standard Deviation (Population) | 5.9% | 13.0% |
Similar Demographics by Disability Age 65 to 74
Demographics Similar to Immigrants from Bosnia and Herzegovina by Disability Age 65 to 74
In terms of disability age 65 to 74, the demographic groups most similar to Immigrants from Bosnia and Herzegovina are Pakistani (23.2%, a difference of 0.040%), Immigrants from Afghanistan (23.2%, a difference of 0.18%), Vietnamese (23.2%, a difference of 0.19%), Sierra Leonean (23.2%, a difference of 0.20%), and Icelander (23.3%, a difference of 0.20%).
| Demographics | Rating | Rank | Disability Age 65 to 74 |
| Koreans | 64.2 /100 | #160 | Good 23.1% |
| Immigrants | Cameroon | 63.8 /100 | #161 | Good 23.1% |
| Europeans | 61.2 /100 | #162 | Good 23.2% |
| Immigrants | Philippines | 61.1 /100 | #163 | Good 23.2% |
| Sierra Leoneans | 60.9 /100 | #164 | Good 23.2% |
| Vietnamese | 60.8 /100 | #165 | Good 23.2% |
| Immigrants | Afghanistan | 60.5 /100 | #166 | Good 23.2% |
| Immigrants | Bosnia and Herzegovina | 57.6 /100 | #167 | Average 23.2% |
| Pakistanis | 57.0 /100 | #168 | Average 23.2% |
| Icelanders | 54.3 /100 | #169 | Average 23.3% |
| Moroccans | 54.2 /100 | #170 | Average 23.3% |
| Cubans | 51.9 /100 | #171 | Average 23.3% |
| Germans | 50.5 /100 | #172 | Average 23.3% |
| Yugoslavians | 50.2 /100 | #173 | Average 23.3% |
| Immigrants | South Eastern Asia | 50.0 /100 | #174 | Average 23.3% |
Demographics Similar to Panamanians by Disability Age 65 to 74
In terms of disability age 65 to 74, the demographic groups most similar to Panamanians are Bahamian (24.4%, a difference of 0.11%), Scotch-Irish (24.4%, a difference of 0.16%), German Russian (24.4%, a difference of 0.19%), Immigrants from Zaire (24.3%, a difference of 0.27%), and West Indian (24.5%, a difference of 0.29%).
| Demographics | Rating | Rank | Disability Age 65 to 74 |
| Nigerians | 7.8 /100 | #227 | Tragic 24.2% |
| Whites/Caucasians | 6.6 /100 | #228 | Tragic 24.2% |
| Celtics | 6.4 /100 | #229 | Tragic 24.2% |
| Barbadians | 6.0 /100 | #230 | Tragic 24.3% |
| Immigrants | Thailand | 5.2 /100 | #231 | Tragic 24.3% |
| Immigrants | Zaire | 5.0 /100 | #232 | Tragic 24.3% |
| Bahamians | 4.5 /100 | #233 | Tragic 24.4% |
| Panamanians | 4.2 /100 | #234 | Tragic 24.4% |
| Scotch-Irish | 3.8 /100 | #235 | Tragic 24.4% |
| German Russians | 3.7 /100 | #236 | Tragic 24.4% |
| West Indians | 3.4 /100 | #237 | Tragic 24.5% |
| Immigrants | Ghana | 3.0 /100 | #238 | Tragic 24.5% |
| Immigrants | Caribbean | 2.6 /100 | #239 | Tragic 24.6% |
| Spaniards | 2.4 /100 | #240 | Tragic 24.6% |
| Immigrants | Western Africa | 2.3 /100 | #241 | Tragic 24.6% |