Immigrants from Barbados vs Colombian Disability Age 65 to 74
COMPARE
Immigrants from Barbados
Colombian
Disability Age 65 to 74
Disability Age 65 to 74 Comparison
Immigrants from Barbados
Colombians
23.8%
DISABILITY AGE 65 TO 74
19.6/ 100
METRIC RATING
208th/ 347
METRIC RANK
22.2%
DISABILITY AGE 65 TO 74
96.4/ 100
METRIC RATING
104th/ 347
METRIC RANK
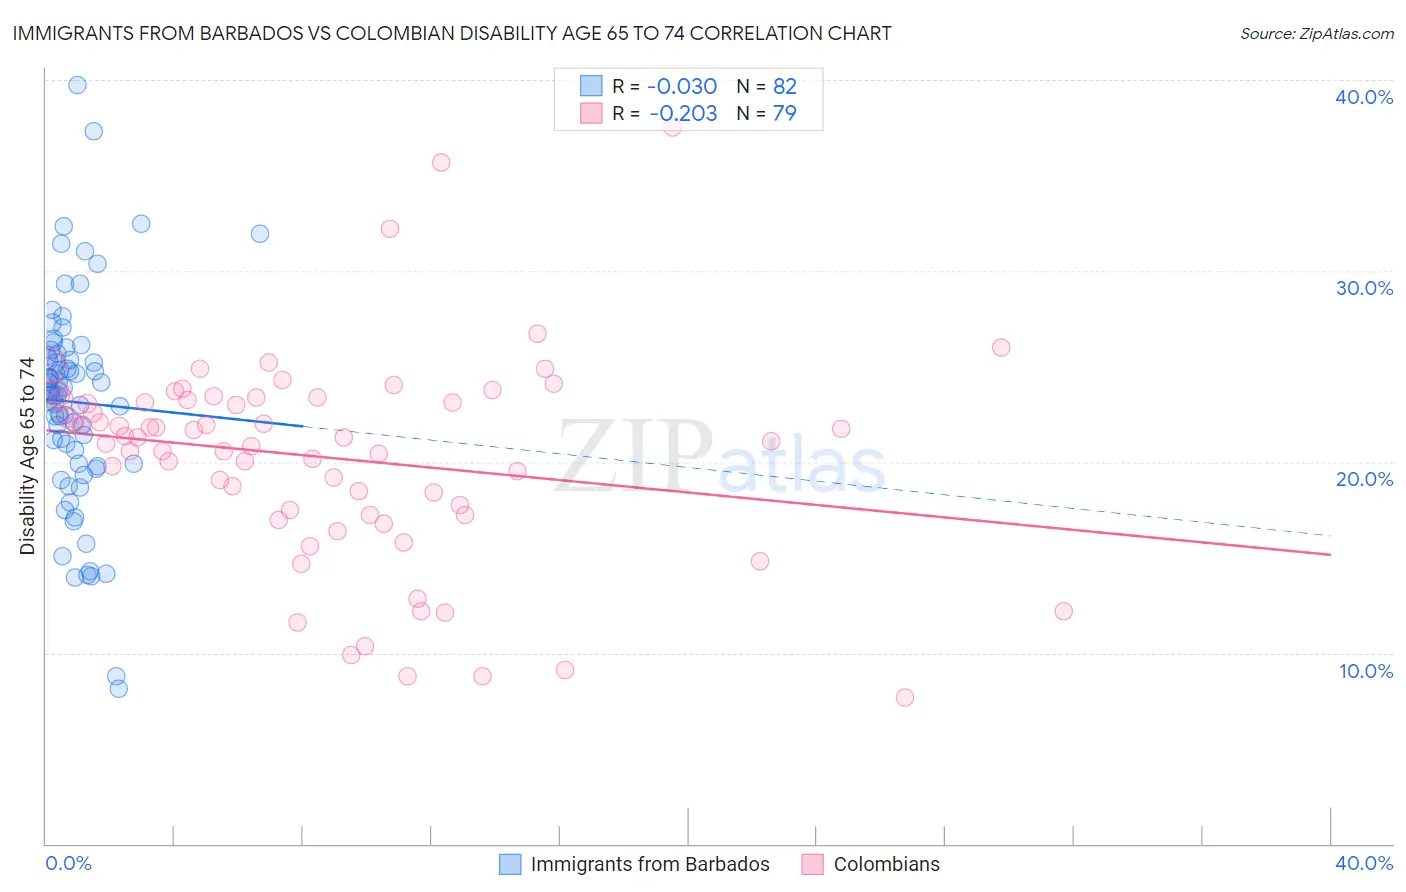
Immigrants from Barbados vs Colombian Disability Age 65 to 74 Correlation Chart
The statistical analysis conducted on geographies consisting of 112,748,711 people shows no correlation between the proportion of Immigrants from Barbados and percentage of population with a disability between the ages 65 and 75 in the United States with a correlation coefficient (R) of -0.030 and weighted average of 23.8%. Similarly, the statistical analysis conducted on geographies consisting of 418,615,153 people shows a weak negative correlation between the proportion of Colombians and percentage of population with a disability between the ages 65 and 75 in the United States with a correlation coefficient (R) of -0.203 and weighted average of 22.2%, a difference of 7.2%.
Disability Age 65 to 74 Correlation Summary
| Measurement | Immigrants from Barbados | Colombian |
| Minimum | 8.1% | 7.7% |
| Maximum | 39.7% | 37.5% |
| Range | 31.6% | 29.8% |
| Mean | 23.1% | 20.2% |
| Median | 23.7% | 21.3% |
| Interquartile 25% (IQ1) | 19.9% | 17.2% |
| Interquartile 75% (IQ3) | 25.6% | 23.3% |
| Interquartile Range (IQR) | 5.6% | 6.0% |
| Standard Deviation (Sample) | 5.4% | 5.5% |
| Standard Deviation (Population) | 5.4% | 5.4% |
Similar Demographics by Disability Age 65 to 74
Demographics Similar to Immigrants from Barbados by Disability Age 65 to 74
In terms of disability age 65 to 74, the demographic groups most similar to Immigrants from Barbados are Immigrants from Kenya (23.8%, a difference of 0.0%), Immigrants from Sudan (23.8%, a difference of 0.040%), Tongan (23.8%, a difference of 0.10%), Immigrants from Jamaica (23.8%, a difference of 0.10%), and Immigrants from Grenada (23.8%, a difference of 0.21%).
| Demographics | Rating | Rank | Disability Age 65 to 74 |
| Immigrants | Ecuador | 23.9 /100 | #201 | Fair 23.7% |
| Immigrants | Bahamas | 23.3 /100 | #202 | Fair 23.7% |
| Kenyans | 23.2 /100 | #203 | Fair 23.7% |
| Immigrants | Grenada | 22.1 /100 | #204 | Fair 23.8% |
| Tongans | 20.8 /100 | #205 | Fair 23.8% |
| Immigrants | Jamaica | 20.7 /100 | #206 | Fair 23.8% |
| Immigrants | Sudan | 20.1 /100 | #207 | Fair 23.8% |
| Immigrants | Barbados | 19.6 /100 | #208 | Poor 23.8% |
| Immigrants | Kenya | 19.6 /100 | #209 | Poor 23.8% |
| Trinidadians and Tobagonians | 16.4 /100 | #210 | Poor 23.9% |
| Immigrants | West Indies | 15.9 /100 | #211 | Poor 23.9% |
| French | 15.7 /100 | #212 | Poor 23.9% |
| Nicaraguans | 14.3 /100 | #213 | Poor 23.9% |
| Immigrants | Oceania | 13.6 /100 | #214 | Poor 24.0% |
| Pennsylvania Germans | 13.3 /100 | #215 | Poor 24.0% |
Demographics Similar to Colombians by Disability Age 65 to 74
In terms of disability age 65 to 74, the demographic groups most similar to Colombians are South American (22.2%, a difference of 0.010%), Immigrants from Saudi Arabia (22.2%, a difference of 0.030%), Palestinian (22.2%, a difference of 0.040%), Immigrants from England (22.2%, a difference of 0.060%), and Uruguayan (22.2%, a difference of 0.070%).
| Demographics | Rating | Rank | Disability Age 65 to 74 |
| Immigrants | Southern Europe | 97.2 /100 | #97 | Exceptional 22.1% |
| Jordanians | 96.9 /100 | #98 | Exceptional 22.2% |
| Immigrants | Colombia | 96.8 /100 | #99 | Exceptional 22.2% |
| Uruguayans | 96.5 /100 | #100 | Exceptional 22.2% |
| Immigrants | England | 96.5 /100 | #101 | Exceptional 22.2% |
| Immigrants | Saudi Arabia | 96.4 /100 | #102 | Exceptional 22.2% |
| South Americans | 96.4 /100 | #103 | Exceptional 22.2% |
| Colombians | 96.4 /100 | #104 | Exceptional 22.2% |
| Palestinians | 96.3 /100 | #105 | Exceptional 22.2% |
| Peruvians | 96.1 /100 | #106 | Exceptional 22.2% |
| Slovenes | 96.1 /100 | #107 | Exceptional 22.2% |
| Immigrants | Zimbabwe | 96.1 /100 | #108 | Exceptional 22.3% |
| Albanians | 95.8 /100 | #109 | Exceptional 22.3% |
| Immigrants | Peru | 95.7 /100 | #110 | Exceptional 22.3% |
| Serbians | 95.7 /100 | #111 | Exceptional 22.3% |